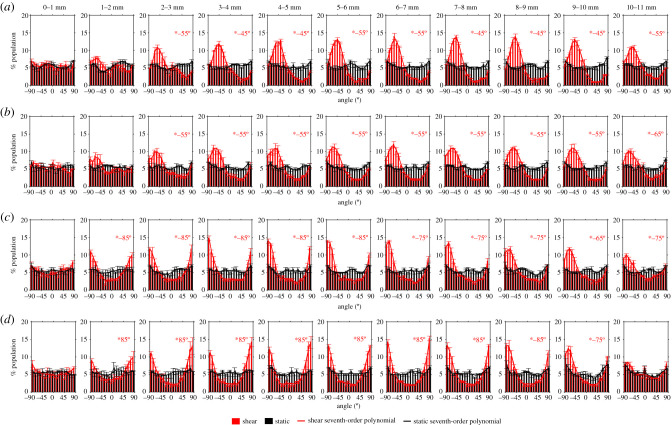
Figure 3.
Frequency histograms of nuclear orientation from the centre to the edge of the well in 1 mm increments. 0° is the radial orientation. Orientations of +90° and −90° are tangential to the side wall of the well and are equivalent: the histograms wrap around so that the left and right ends of the x-axis are continuous with each other. The lines are best-fit seventh-order polynomials. At radial locations where there was a significant difference between profiles for static and sheared conditions, the modal nuclear orientation under shear is indicated. Viscosities were (a) 0.8 mm2 s−1 (control model), (b) 2.2 mm2 s−1, (c) 3.4 mm2 s−1 and (d) 4.0 mm2 s−1. Mean ± s.e.m., n = 3.

