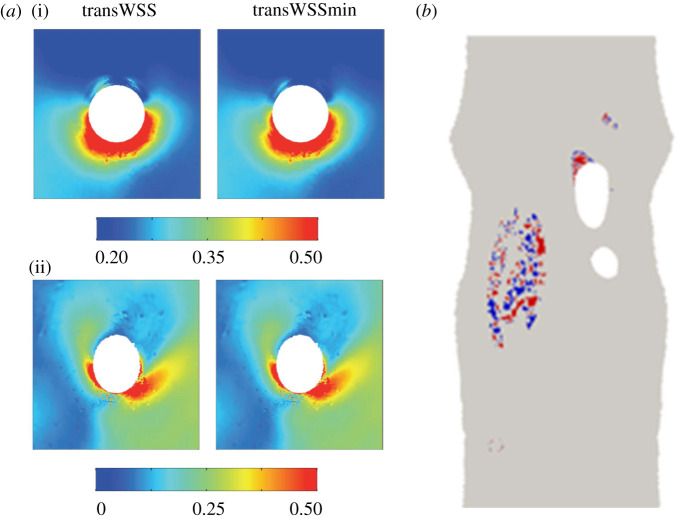
Figure 5.
(a) TransWSS and transWSSmin around the origin of an intercostal artery in the rabbit aorta. (i) and (ii) show, respectively, the average of all individual branches and a representative individual branch. (The white circle represents the ostium itself and has a diameter of approximately 0.5 mm.) Values are in pascal (from [36], with permission). (b) En face map of a rabbit aortic arch that has been opened to show regions where CFD simulations of blood flow indicate greater than 20° discrepancy between the direction of the mean WSS vector and the direction that minimizes transWSS. (Areas are coded red or blue depending on whether the discrepancy is rotated clockwise or anticlockwise relative to the mean vector.) Simulations in eight additional animals show essentially the same pattern. In all cases, mean aortic flow is from top to bottom of the map.

