
Figure 1.
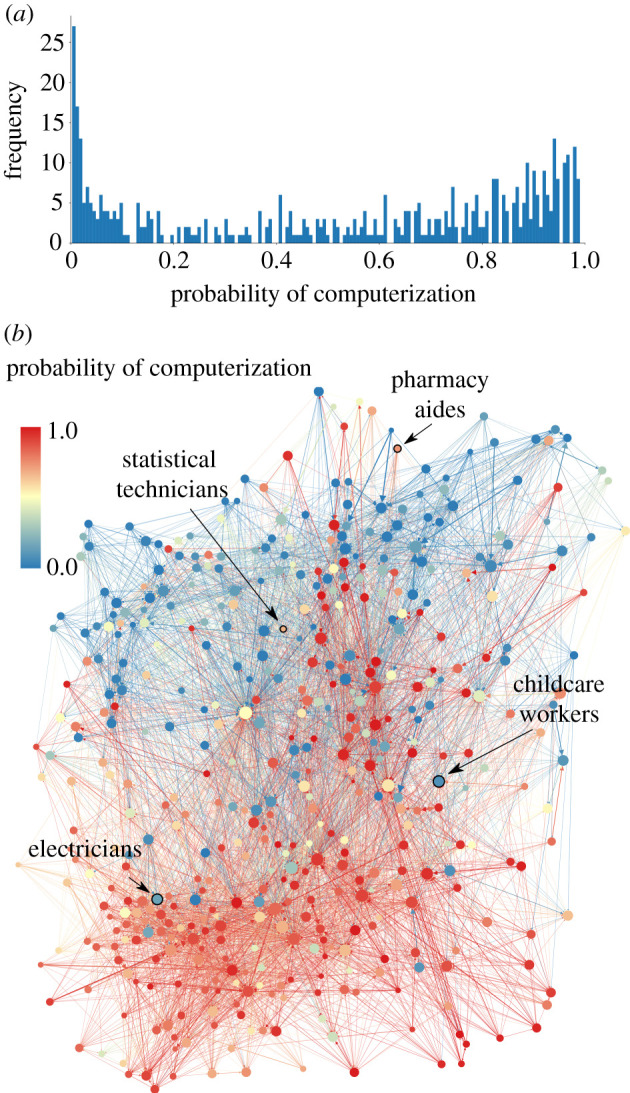
Estimates of automatability in the occupational mobility network. (a) A histogram of the probability of computerization for different occupations as estimated by Frey and Osborne [8], suggesting a bimodal distribution. (b) The occupational mobility network, where nodes represent occupations and links represent possible worker transitions between occupations. Red nodes have high automatability, and blue nodes have low automatability. The size of the nodes indicates the logarithm of the number of employees in each occupation.