
Figure 4.
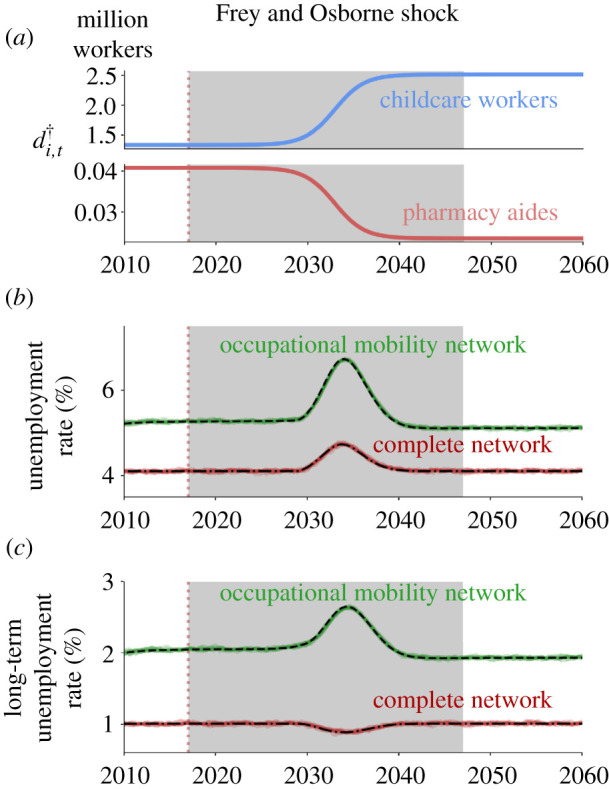
Aggregate labour market outcomes under the Frey and Osborne shock. The grey area denotes the 30 years during which the automation shock takes place. (a) The evolution of the target labour demand for two example occupations. The occupation coloured in blue has a low automation level and the occupation coloured in red has a high level. Because of its heterogeneity across occupations, the Frey and Osborne shock implies a large change in the target labour demand of most occupations. (b) The unemployment rate as a function of time. Dashed lines are our approximations of the expected value (solved numerically) and the solid lines are 10 simulations with 1.5 M agents. (c) The long-term unemployment rate as a function of time. As before, dashed lines correspond to the deterministic approximation of equations (3.1)–(3.3) and solid lines to the full stochastic model simulation of equations (2.2)–(2.4).