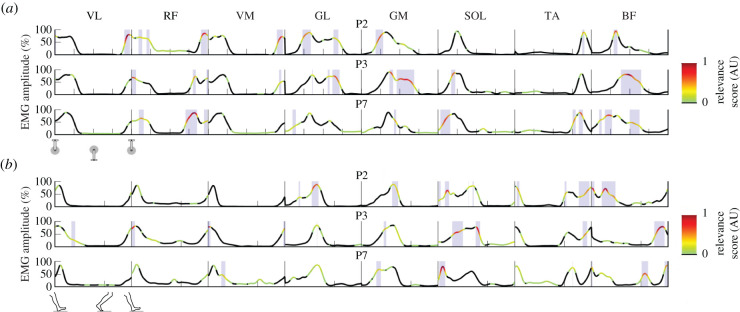
Figure 2.
Example results of the relevance scores for three participants (P). The lines show the mean (over 30 cycles) muscle activation patterns for eight lower limb muscles (VL, vastus lateralis; RF, rectus femoris; VM, vastus medialis; GL, gastrocnemius lateralis; GM, gastrocnemius medialis; SOL, soleus; TA, tibialis anterior; BF, biceps femoris long head) during pedalling (a) and walking (b). The colour bar represents the output relevance scores from the LRP technique. Only positive relevance scores, which contribute to the classification of that individual, were considered and, therefore, all negative and zero scores are coloured in black. The closer the score is to 1, the more relevant the section of the EMG pattern is for recognition of that individual. The shaded areas represent relevance scores greater than the arbitrary threshold of 0.2. The data in (a) start with the pedal at top dead-centre and the x-axis ticks denoting 25%, 50% and 75% of the pedalling cycle for each muscle. The data in (b) start at heel-strike and the single x-axis tick denotes the transition between the stance and swing phase.

