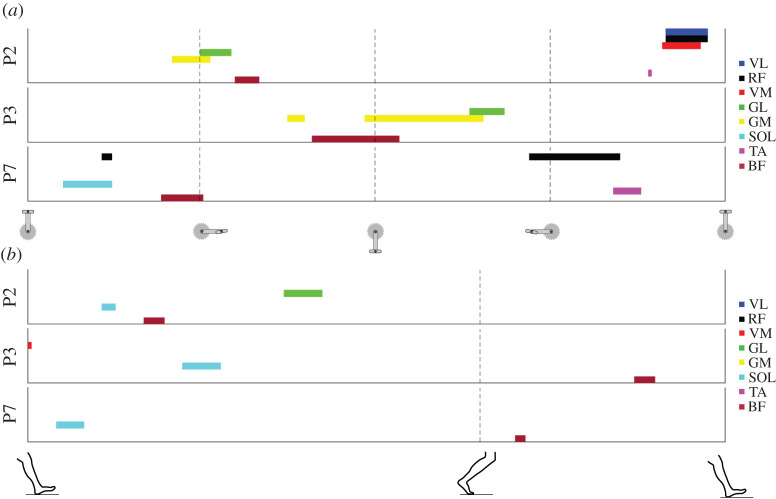
Figure 5.
Visualization of muscle activation signatures. Example muscle activation signature maps for three participants (P) for pedalling (a) and gait (b). Each colour represents a different muscle as shown on the right. The data in (a) start with the pedal at top dead-centre and the vertical dashed lines denote 25%, 50% and 75% of the pedalling cycle. The data in (b) start at heel-strike and the single vertical dashed line denotes the transition between the stance and swing phase.

