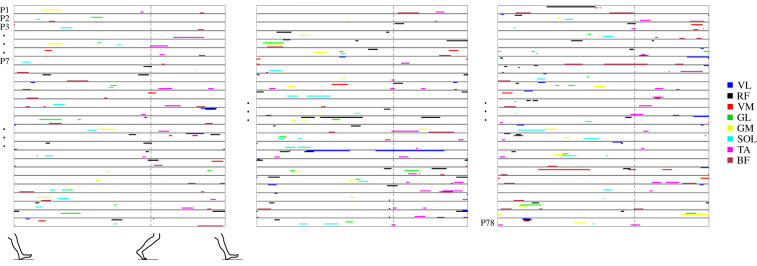
Figure 7.
Muscle activation signatures for walking. Overview of the muscle activation signature maps of all 78 participants for the baseline walking task, day 1. Each row shows the signature map for a single participant (P), starting with participant number 1 at the top of the left panel and ending with participant number 78 at the bottom of the right panel. The example participants (P2, P3 and P7) for figures 2 and 4 are indicated. Each colour represents a different muscle as shown on the right.

