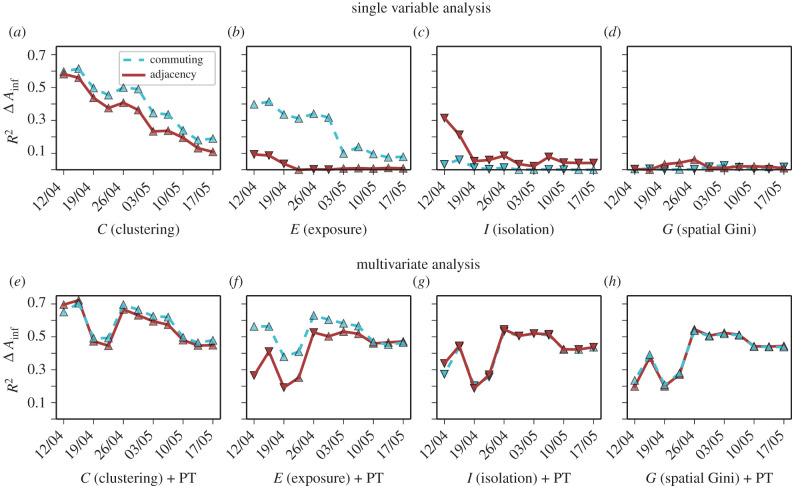
Figure 4.
Temporal evolution of incidence gap correlations and multivariate analysis with public transport usage. Evolution of the Pearson correlation (R2) between African American incidence gap and (a) diffusion clustering, (b) diffusion exposure, (c) diffusion isolation, (d) spatial Gini coefficient on the adjacency (solid red lines) and commuting graphs (dashed blue lines). Multivariate analysis of the same indices and usage of public transportation by African Americans for (e) diffusion clustering, (f) diffusion exposure, (g) diffusion isolation, (h) spatial Gini coefficient. The type of marker indicates the sign of the correlation (triangles pointing up for positive correlations, and down for negative correlation). Given the uneven temporal reporting of ethnicity data, each temporal snapshot has a slightly different number of US states. We have also tried alternative formulations for C and E obtaining significant correlations, as shown in electronic supplementary material, figure S9. The multivariate analysis was performed using R and the ANOVA model type II in the car package.

