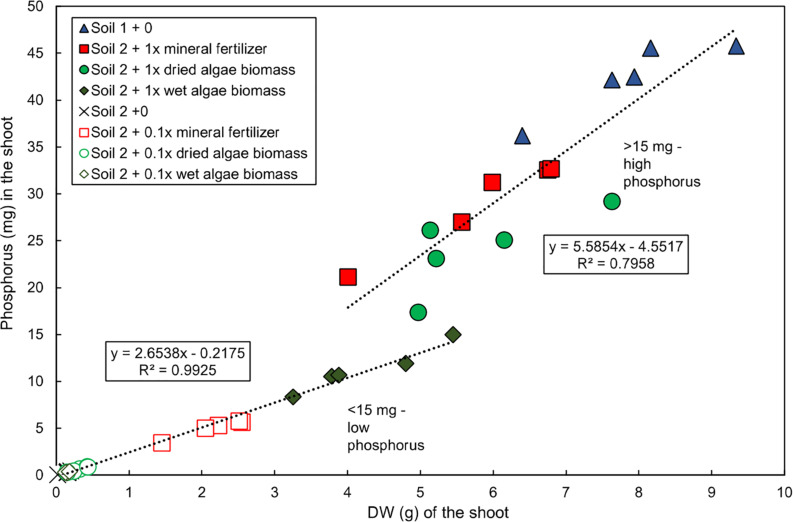
FIGURE 1.
Linear relationship of total P and shoot dry weight of wheat grown with various nutrient sources. Data for total shoot P and shoot dry weight replotted directly from Schreiber et al. (2018). Plants were grown in controlled conditions in the following substrates: soil 1 (nutrient-rich; triangles); soil 2 (nutrient-poor; crosses); or soil 2 with addition of: mineral fertilizer (squares), dried algae biomass (circles) or wet algae biomass (diamonds) either with high (filled forms, 1x) or low amounts (empty forms, 0.1x). Linear correlations were manually fitted to two groups: low P content plants and high P content plants. Each point represents a single plant. n = 20 plants for low P group; n = 15 for high P group.

