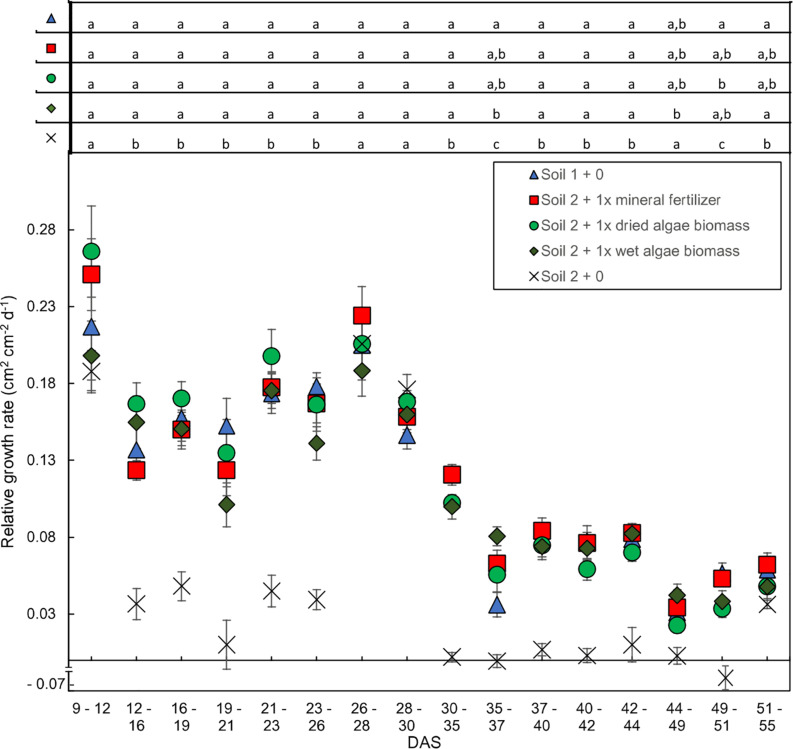
FIGURE 3.
Relative shoot growth rates over time dependent on nutrient source. Relative growth rates are based on change in leaf area per unit leaf area during 2–5-day intervals. Plants were grown in controlled conditions in the following substrates: soil 1 + 0 (triangles); soil 2 + 0 (crosses); or soil 2 with addition of: 1x mineral fertilizer (squares), 1x dried algae biomass (circles) or 1x wet algae biomass (diamonds). Each point represents the mean of n = 10 plants with standard error bars. Statistical differences were analyzed using ANOVA and Tukey multiple comparison of means test post hoc test both compared between days (top of the figure). Different letters indicate significant differences with p < 0.05. The break in y-axis was inserted manually together with the negative growth value for soil 2 + 0 on interval 49–51 (–0.068 cm2 cm−2 d−1).

