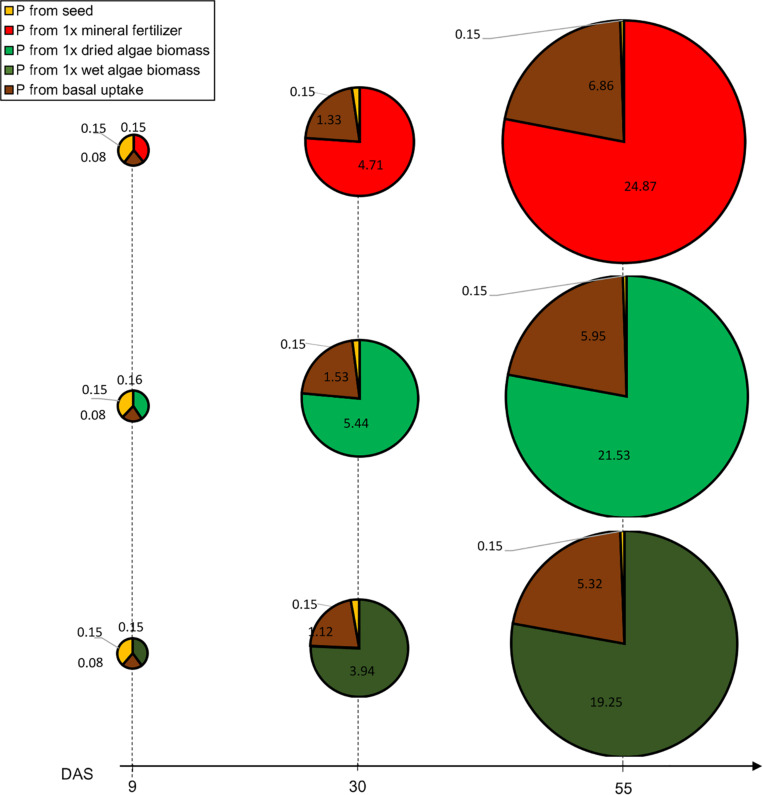
FIGURE 4.
Contribution to P uptake from seed, soil or nutrient source in plants provided with mineral fertilizer or dried algae over time. Values indicate P (in mg) at different time points. P uptake is represented for plants grown in soil 2 + 1x mineral fertilizer (top row), plants grown in soil 2 + 1x dried algae biomass (middle row), and soil 2 + 1x wet algae biomass (bottom row). The area of the circle represents the total P measured at harvest (55 DAS), each circle piece the indicated source. The basal P uptake from the was approximated based on plants grown in soil 2 without addition of nutrients (see section “Materials and Methods”). During the growth period, total P uptake was calculated based on the projected leave area. Values are means per nutrient source (n = 5) per time point.

