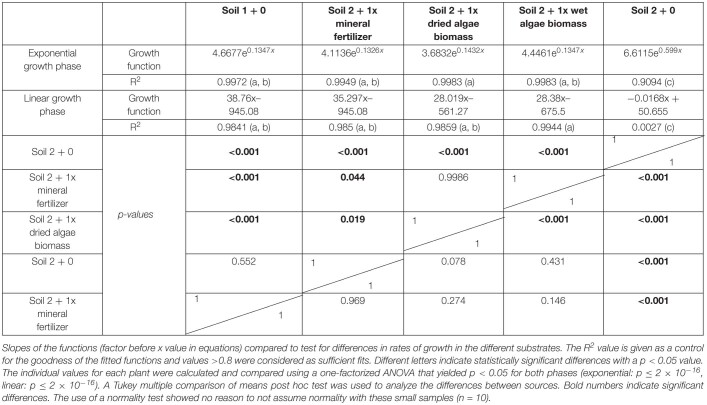
TABLE 2.
Leaf area of plants grown with mineral fertilizer or different algae forms: Equations for the exponential and linear phases of Figure 3.
Slopes of the functions (factor before x value in equations) compared to test for differences in rates of growth in the different substrates. The R2 value is given as a control for the goodness of the fitted functions and values >0.8 were considered as sufficient fits. Different letters indicate statistically significant differences with a p < 0.05 value. The individual values for each plant were calculated and compared using a one-factorized ANOVA that yielded p < 0.05 for both phases (exponential: p ≤ 2 × 10–16, linear: p ≤ 2 × 10–16). A Tukey multiple comparison of means post hoc test was used to analyze the differences between sources. Bold numbers indicate significant differences. The use of a normality test showed no reason to not assume normality with these small samples (n = 10).

