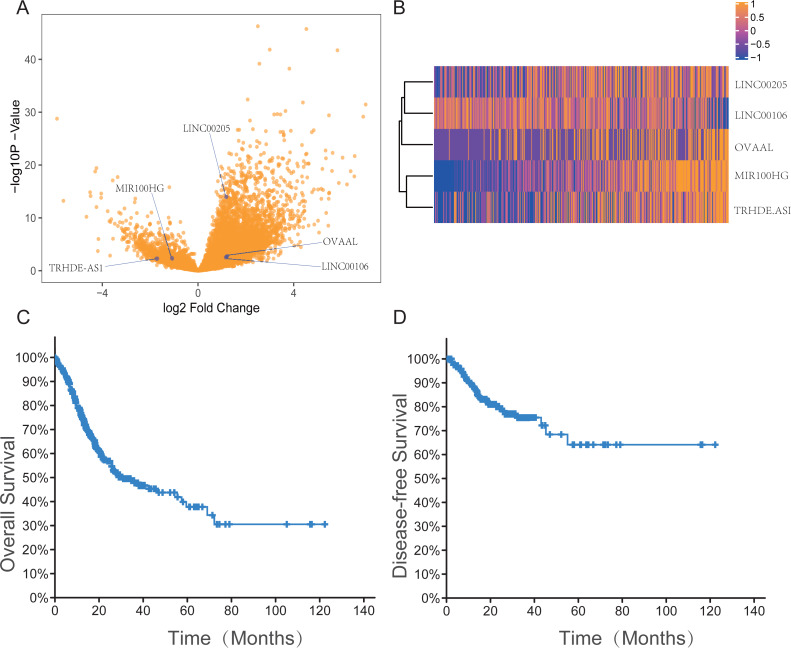
Figure 1. The expression information of five lncRNAs, overall survival and disease free survival in gastric cancer patients in the TCGA dataset.
(A) Volcano plot with blue dots indicating five lncRNAs expression levels which is significantly different between tumor and normal tissue based on the criteria of an absolute log2 fold change (FC) >1 and adjusted P < 0.05. (B) Heatmap of the five-lncRNA expression profile of the 414 patients in the TCGA dataset. Among five lncRNAs, MIR100HG and TRHDE-AS1 have a similar expression in 414 patients in the TCGA dataset, otherwise the other three lncRNAs do as well. (C–D) The survival curves based on the OS and DFS of the 408 patients in TCGA dataset.

