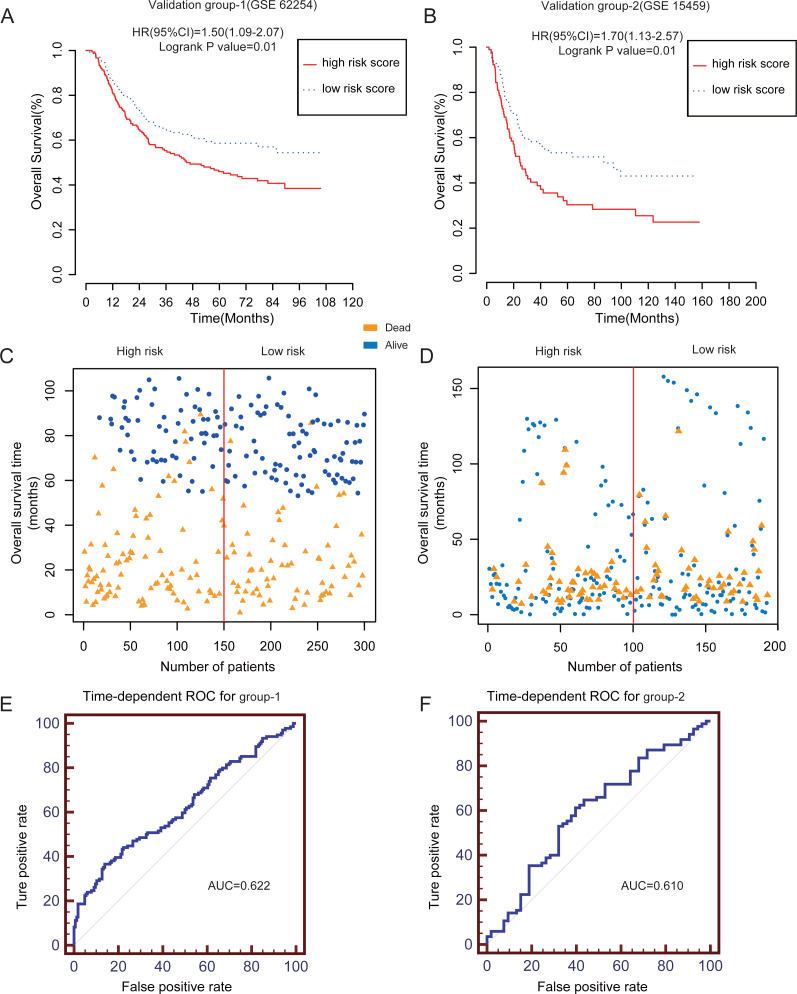
Figure 3. The prognostic value of lncRNA-based risk model in two independent GEO validation groups.
(A–B) Kaplan–Meier analysis of predicting OS of GC patients based on the high risk and low risk subgroups in two independent validation groups (GSE62254 and GSE15459). (C–D) The scatter plot of five-lncRNA-based risk score distribution for patient survival status in two independent validation groups.(E–F) The time-dependent ROC analysis of the risk score for prediction the 4-year cutoff OS of the two independent validation groups. The area under the curve was calculated for ROC curve.

