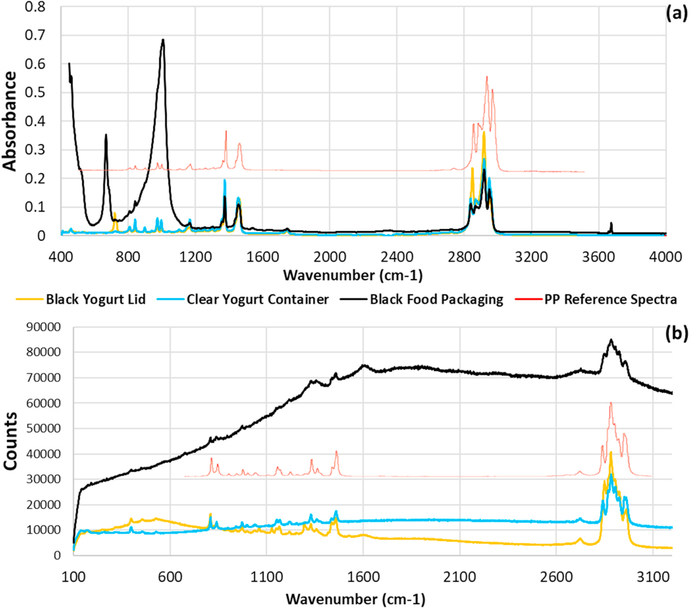
Fig. 1.
Spectral differences in FTIR (a) and Raman (b) microscopy due to dark additive(s) in PP items. The ATR-FTIR spectra (a) show additional peaks from the additive(s), while the Raman result for a black food packaging had high background. In both cases, characteristic peaks for PP are present. (reference spectra from Thermo Fisher [56].

