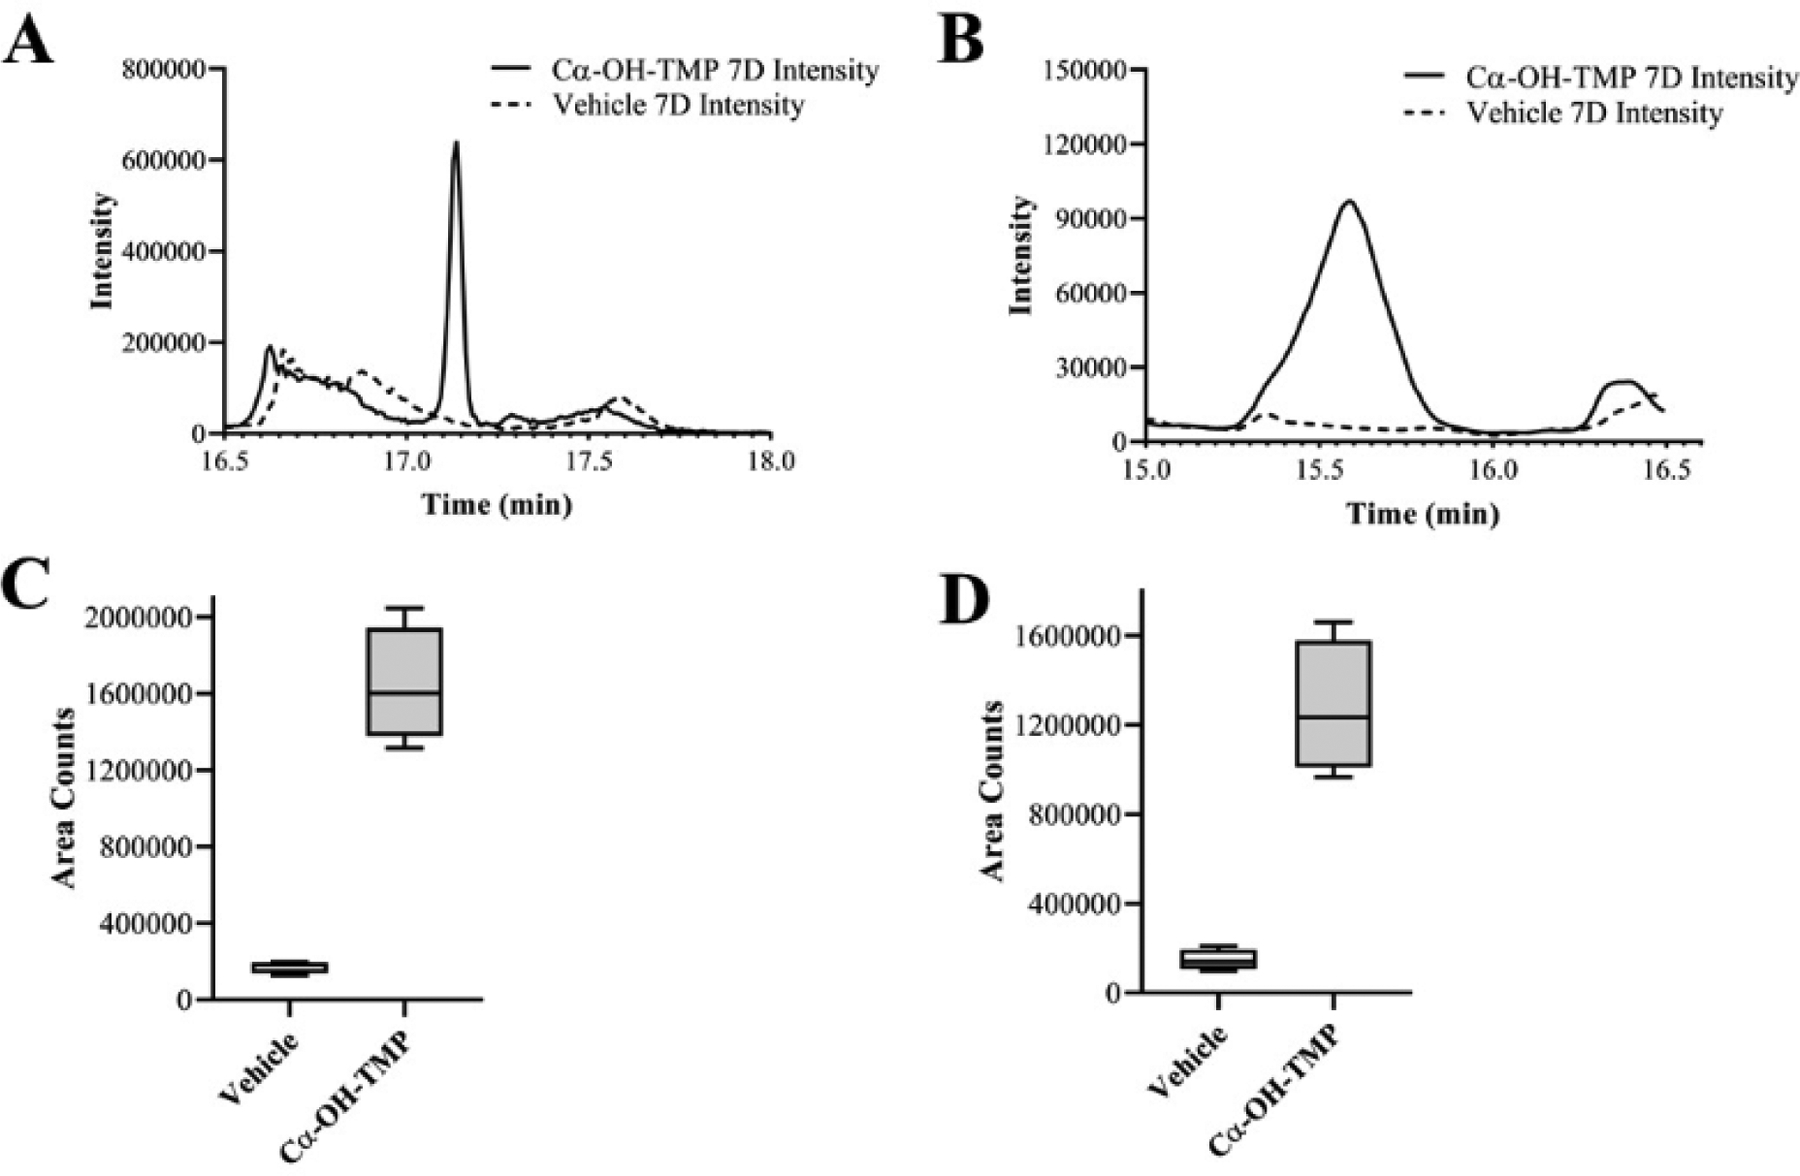
Fig. 3.

Representative extracted ion chromatograms (EICs) and area boxplots from XCMS data a, EIC for Peptide 1 (681.1) b, EIC for Peptide 2 (816.37) c, boxplot for Peptide 1 (681.1) d, boxplot for Peptide 2 (816.37). Boxes depict the 25–75th percentiles with the whiskers depicting the minimum and maximum values
