
Fig. 4.
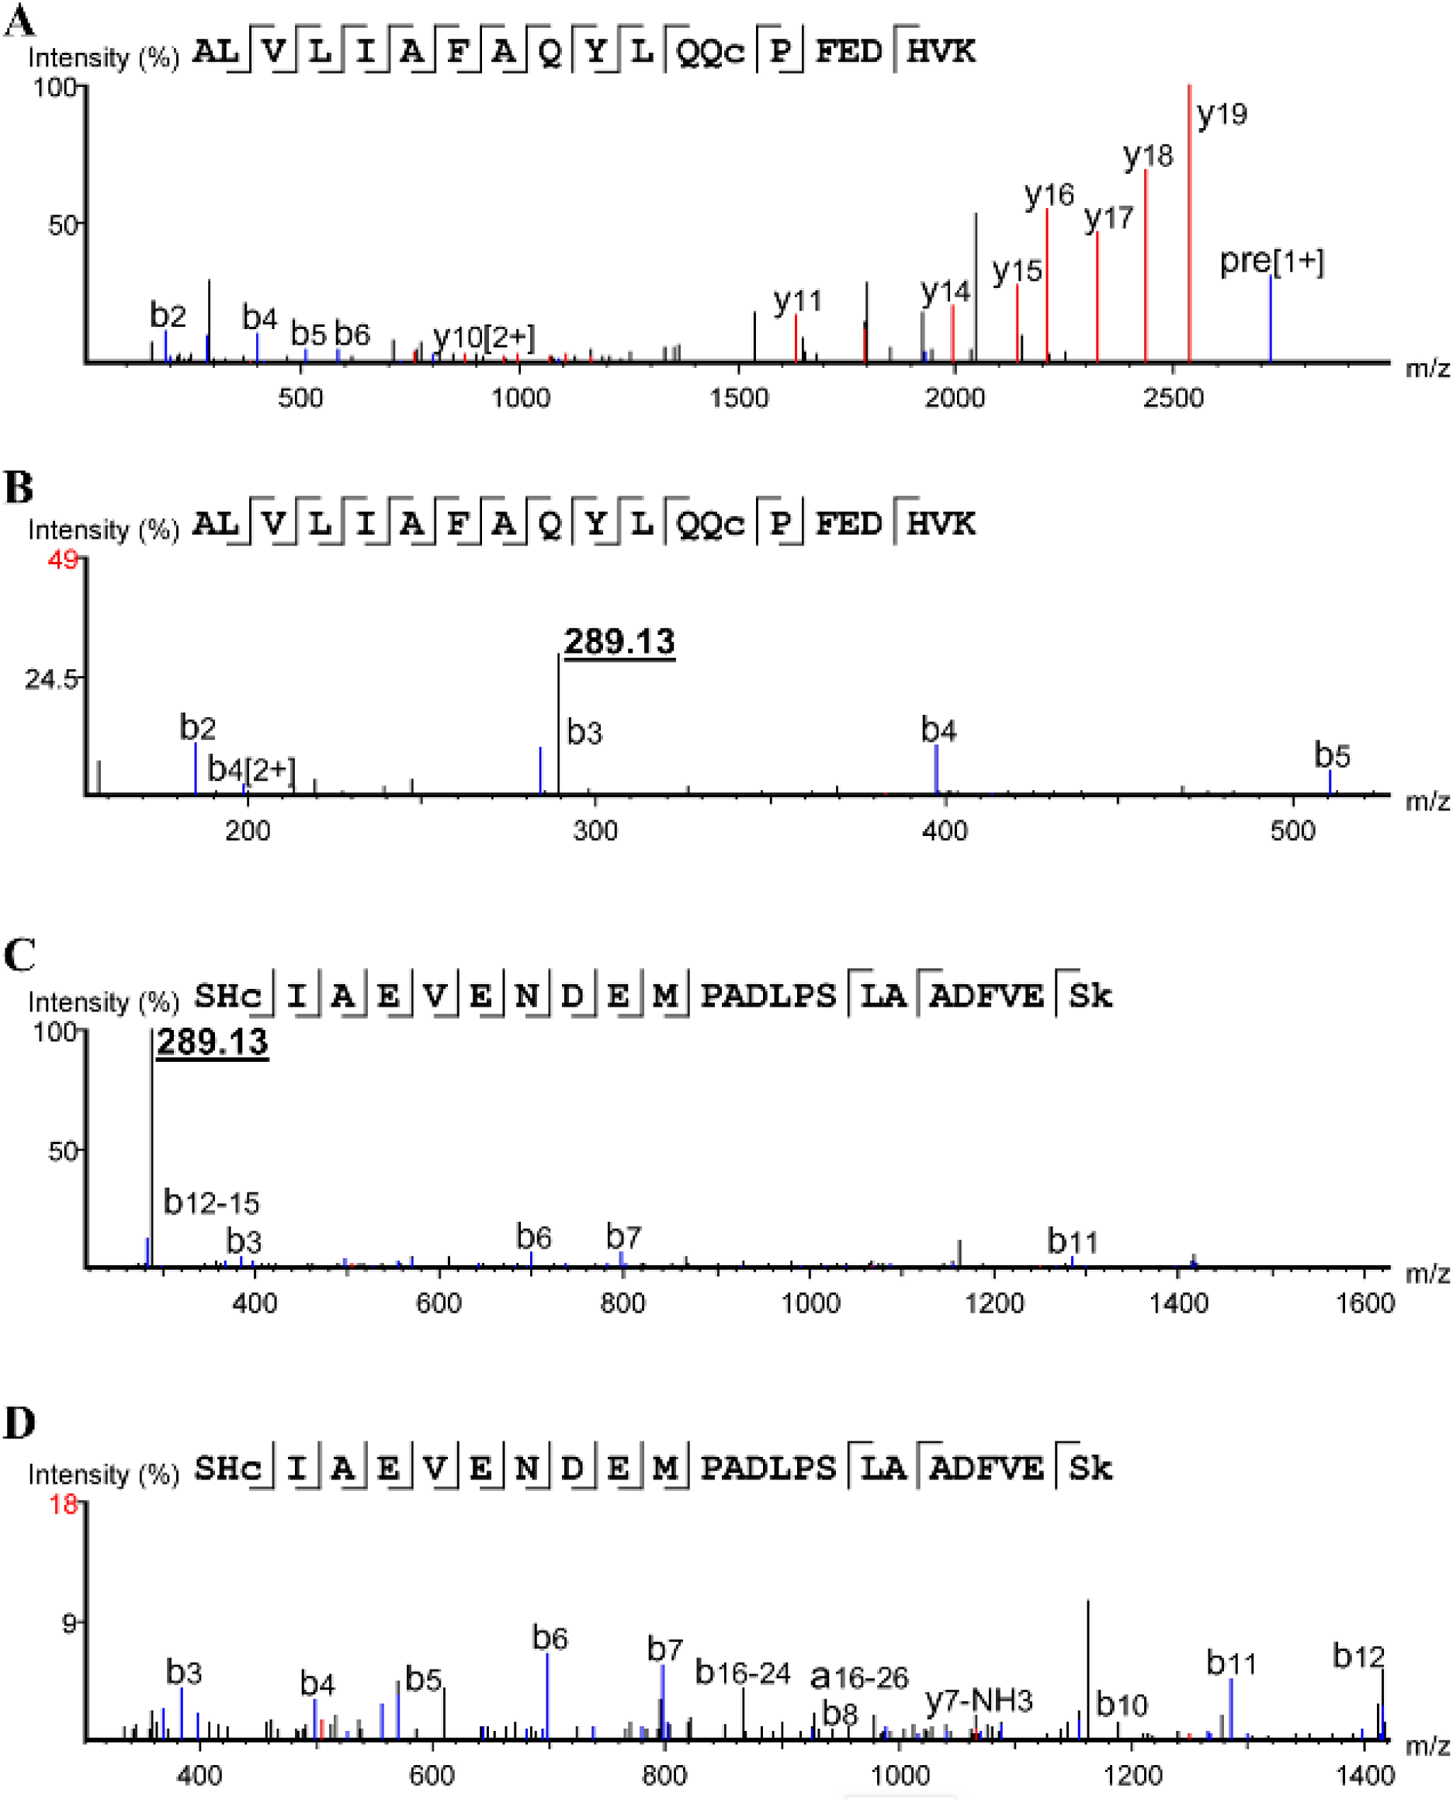
Fragmentation spectra a, spectrum of Peptide 1 (m/z 681.1) showing b and y ions b, zoomed in spectrum of Peptide 1 (m/z 681.1) showing 289.13 reporter c, zoomed out spectrum of Peptide 2 (m/z 816.37) showing 289.13 reporter d, spectrum of Peptide 2 (m/z 816.37) showing b and y ions