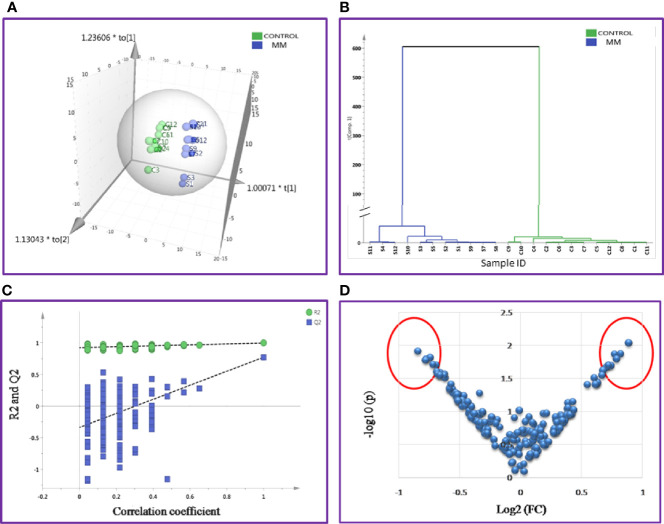
Figure 5.
Multivariate statistical analysis of MM serum vs. Control dataset using SWATH MS data. (A) OPLS-DA score plot for MM vs. Controls. (B) Dendrogram showing the hierarchical clustering between MM and controls based on DEPs. (C) Permutation test statistics of the OPLS-DA model of MM vs. Controls with Y-axis intercepts: R2 = (0.0, 0.924), Q2 = (0.0, −0.338), (D) V-Plot showing the most significant proteins in red circles. One sample in MM was removed from the SIMCA analysis as they had high degree of variation; hence the data shown is for eleven MM samples and twelve controls.

