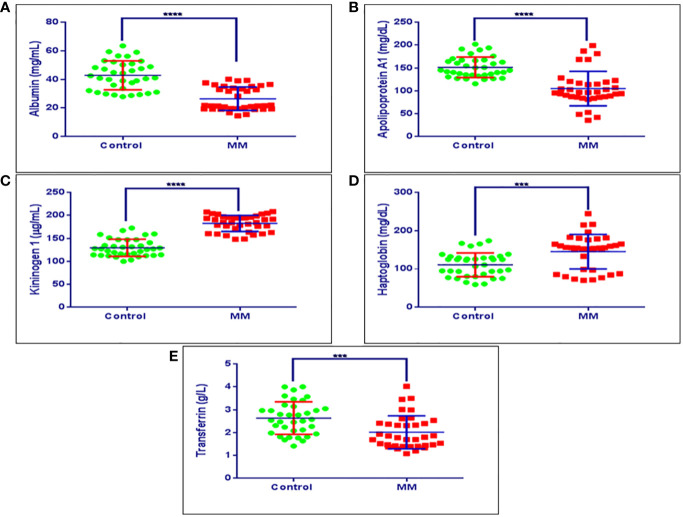
Figure 8.
Validation experiments for some of the candidate proteins using ELISA. (A) Concentration ranges of serum albumin in healthy controls (42.80 mg/ml ± 10.13 mg/ml), MM patients (26.45 mg/ml ± 8.14 mg/ml). (B) Concentration ranges of serum apolipoprotein a1 in healthy controls (152.05 mg/dl ± 30.61 mg/dl), MM patients (105.97 mg/dl ± 38.80 mg/dl). (C) Concentration ranges of serum kininogen 1 in healthy controls (139.38 µg/dl ± 28.98 µg/dl), MM patients (173.95 µg/dl ± 26.60 µg/dl), (D) Concentration ranges of serum haptoglobin in healthy controls (110.86 mg/dl ± 30.99 mg/dl), MM patients (145.28 mg/dl ± 45.03 mg/dl). (E) Concentration ranges of serum transferrin in healthy controls (2.64 g/L ± 0.69 g/L), MM patients (1.76 g/L ± 0.48 g/L). Healthy control serum samples (n = 36), MM patients serum samples (n = 36). ****p-value ≤ 0.0001, ***p-value ≤ 0.001.

