
Figure 1. Deletion of NFIA in mature astrocytes selectively reduces morphological complexity.
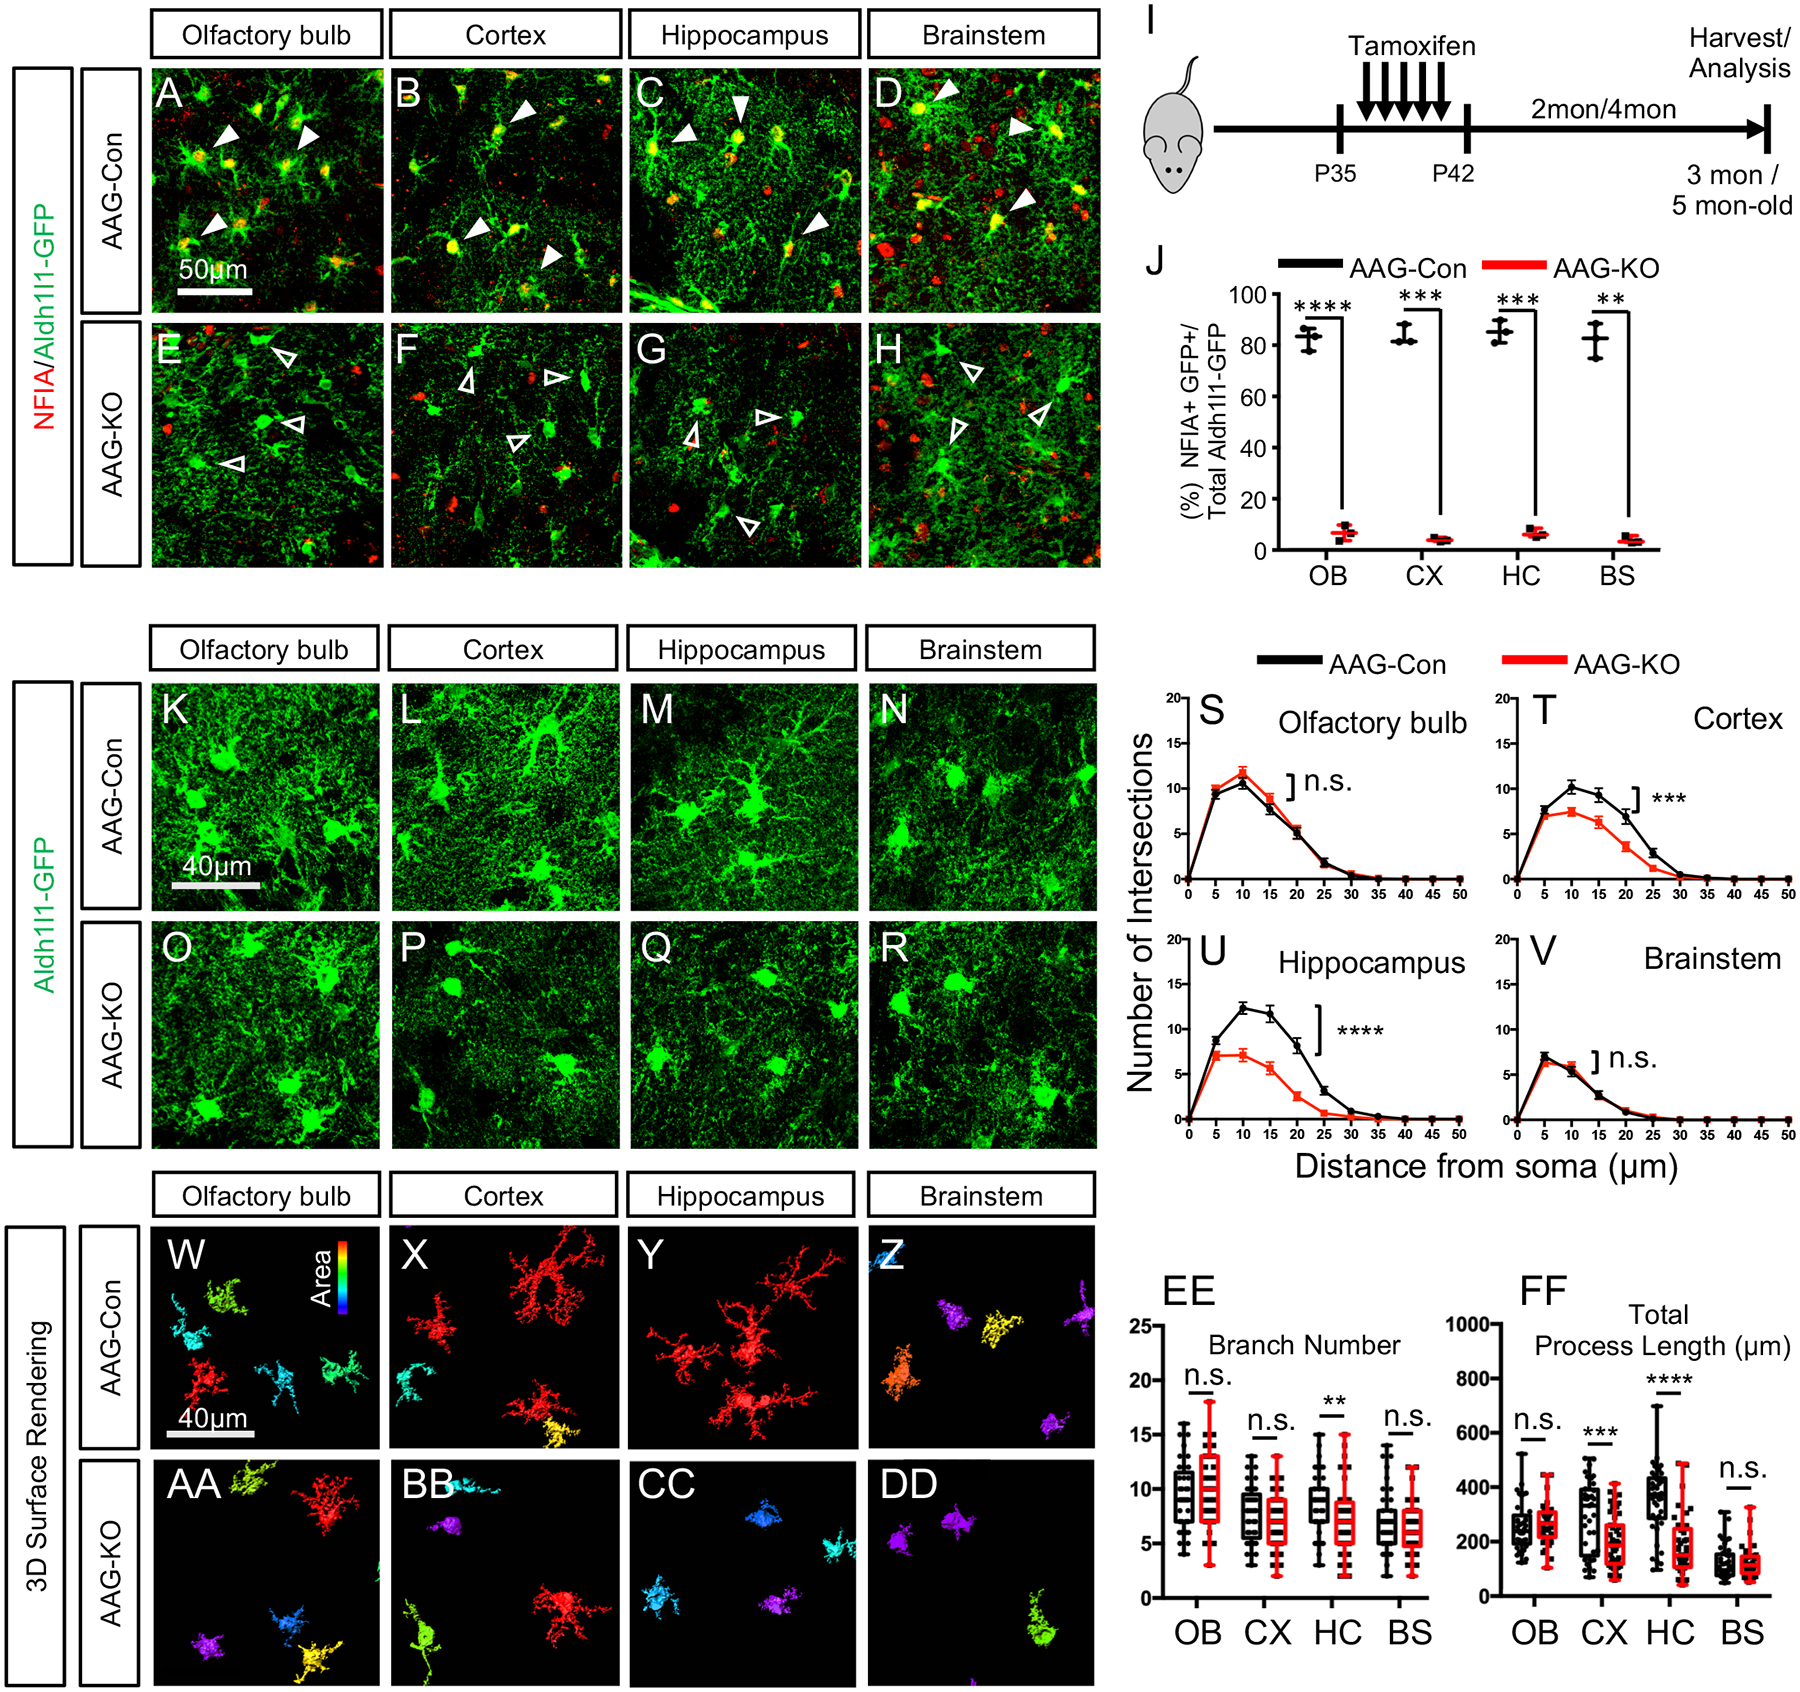
(A–H) Co-expression of NFIA and Aldh111 -GFP from AAG-Con and AAG-KO mice. Filled arrows in A-D show co-expression of Aldh1l1-GFP and NFIA, unfilled arrows in E–H show Aldh1l1-GFP cells that do not express NFIA. (I) Tamoxifen treatment paradigm. (J) Quantification of NFIA/Aldh1l1-GFP co-expression in AAG-Con and AAG-KO mice. Data derived from 3 mice per genotype, 3 slides per region, per mouse. At least 100 cells per region, per mouse. Two-tailed unpaired t-test.(Ruxton, 2006) (K–R) High magnification confocal images of Aldh1l1-GFP from AAG-con or AAG-KO mice. (S–V) Scholl Analysis of astrocyte complexity. Two-way repeated measures ANOVA. (W–DD) 3D-surface rendering of high magnification images from k-r. (EE, FF) Branch number and total process length quantification. Two-tailed unpaired t-test. In S-V and EE-FF data is derived from 3 mice per genotype, 3 slides per region, per mouse, with at least 30 cells per region, per genotype. OB: olfactory bulb; CX: cortex; HC: hippocampus; BS: brainstem. AAG-Con, denotes: NFIAfl/fl; Aldh1l1-GFP. AAG-KO denotes: NFIAfl/fl; Aldh1l1-CreER; Aldh1l1-GFP. *p<0.05, **p< 0.01, ***p<0.001, ****p<0.0001. Also see Figure S1–S3.