
Figure 3. Region-specific gene regulation and DNA-binding properties of NFIA.
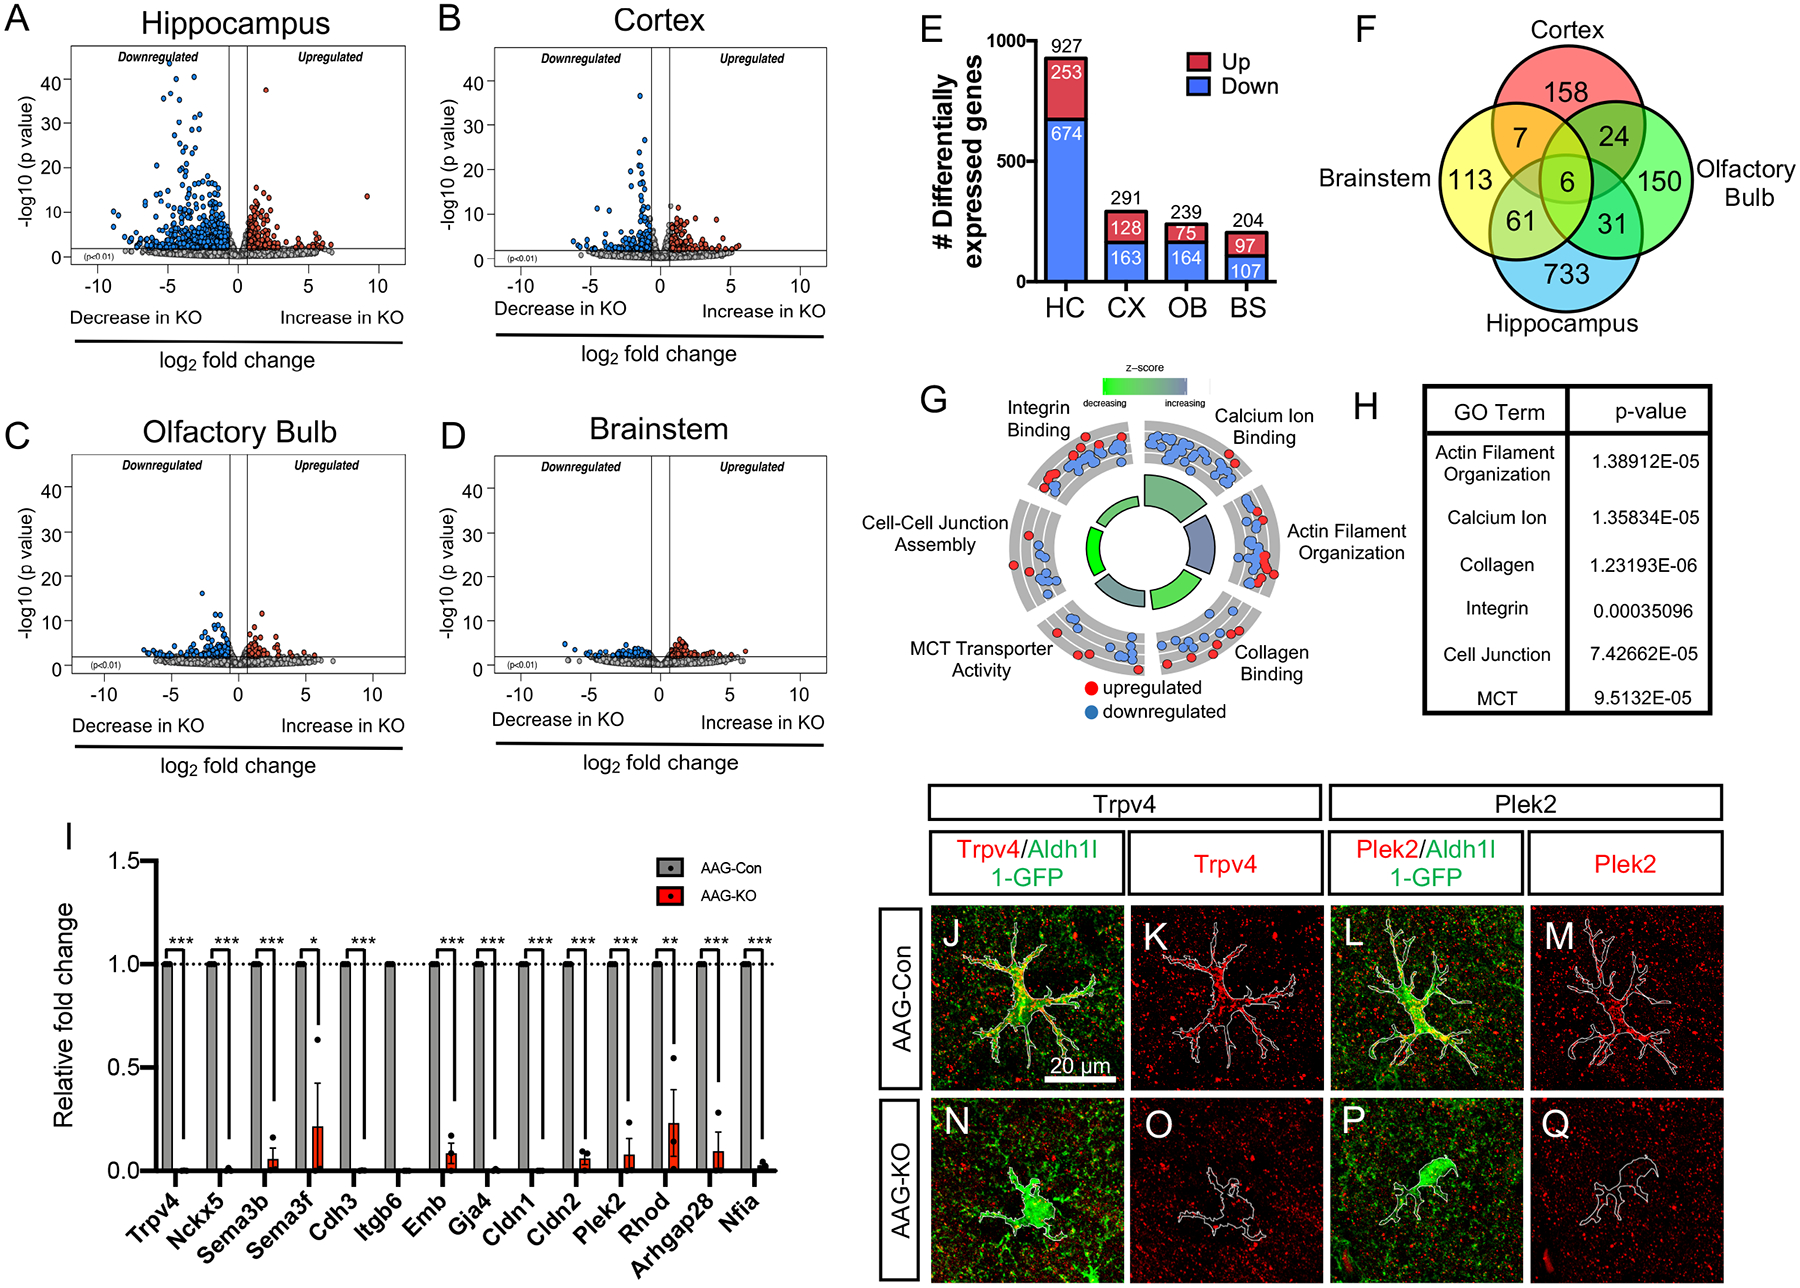
(A–D) Volcano plots depicting RNA-Seq data comparing AAG-Con and AAG-KO transcriptome data across diverse brain regions. RNA-Seq experiments from each genotype, from each region was performed in triplicate; p=0.01, fold change = 1.5 fold (E) Bar graph showing the total number of differentially expressed genes from each region. (F) Venn Diagram depicting the overlapping and unique differentially expressed genes across the four brain regions. (G,H) Gene Ontology Circle plot and table, showing the top GO terms found in the differentially expressed genes from the hippocampus. (I) qRT-PCR validation of key genes differentially expressed in the hippocampus of AAG-KO mice. (J–Q) Immunostaining of AAG-Con and AAG-KO hippocampus with antibodies to Trpv4 and Plek2. *p<0.05 and ***p<0.001. Also see Figure S6–S7.