
Figure 6. Loss of NFIA does not affect basal synaptic properties in the hippocampus.
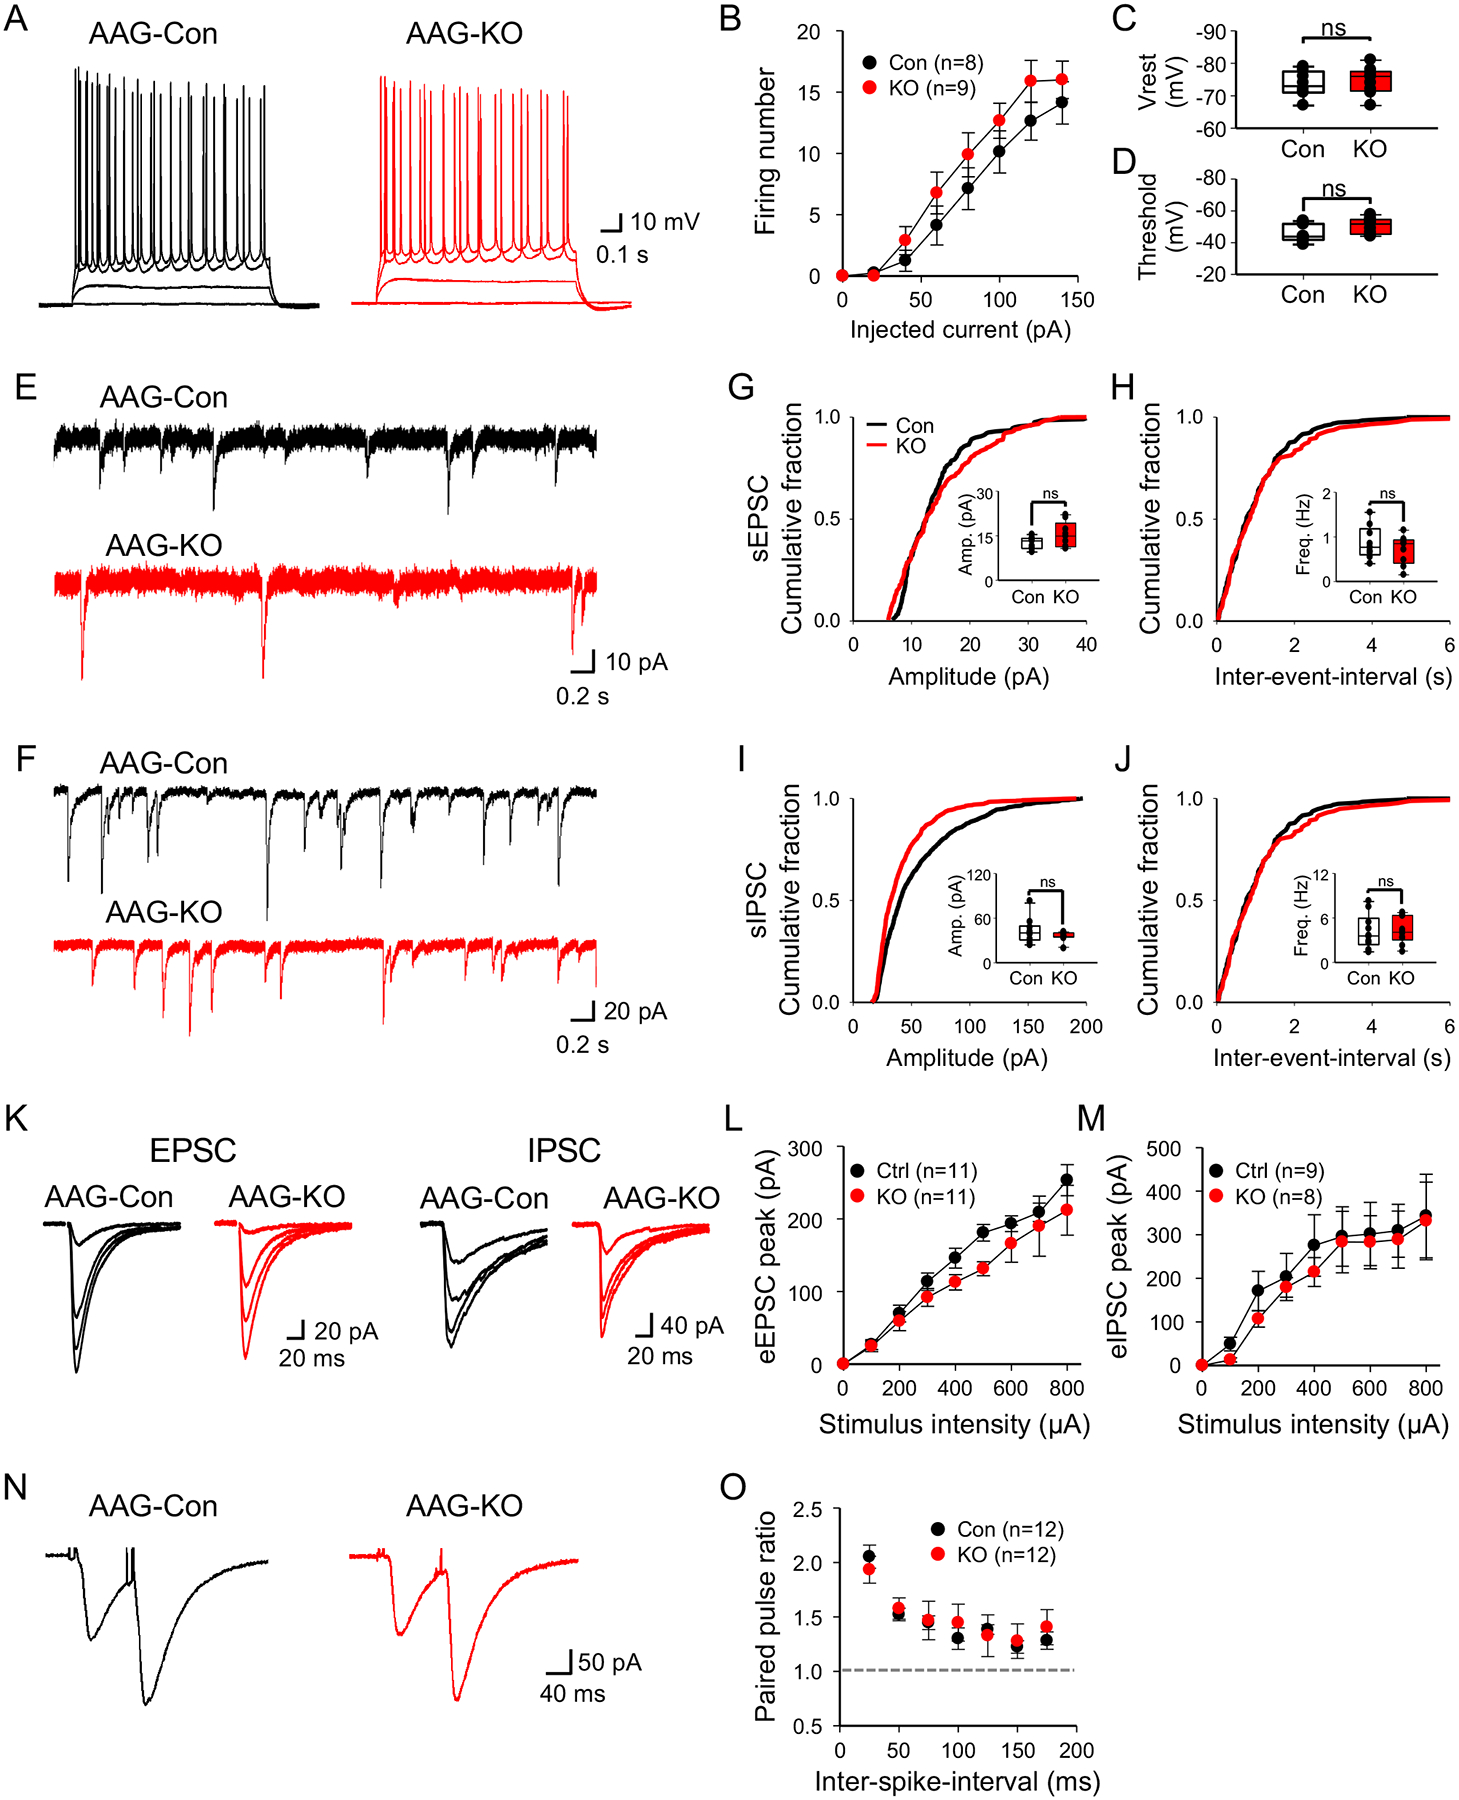
(A) Representative traces of action potential in CA1 pyramidal neurons upon varying the injected current from AAG-Con and AAG-KO. (B) Summary data of action potential firing. (c,d) Summary data of resting membrane potential (C) and threshold (D). (E,F) Representative traces of spontaneous EPSCs (E) and IPSCs (F) from AAG-Con and AAG-KO. (G–J) Summary data of amplitude and frequency in sEPSC (G,H) and sIPSC (I,J) derived from 3 mice from each genotype, 9–10 cells. (K) Representative traces of input-output curve in evoked EPSC (Left) and IPSC (Right) from AAG-Con and AAG-KO. (L,M) Summary data of evoked EPSC (L) and IPSC (M). (N) Representative traces of paired pulse ratio (PPR) upon varying the inter-spike-interval (ISI) from AAG-Con and AAG-KO. (O) Summary data of PPR. Student’s two-tailed unpaired t-test (C,G–J) and two-way ANOVA with Sidak test (B,L,M,O). AAG-Con denotes: NFIAfl/fl; Aldh1l1-GFP. AAG-KO denotes: NFIAfl/fl; Aldh1l1-CreER; Aldh1l1-GFP.