FIGURE 3 |.

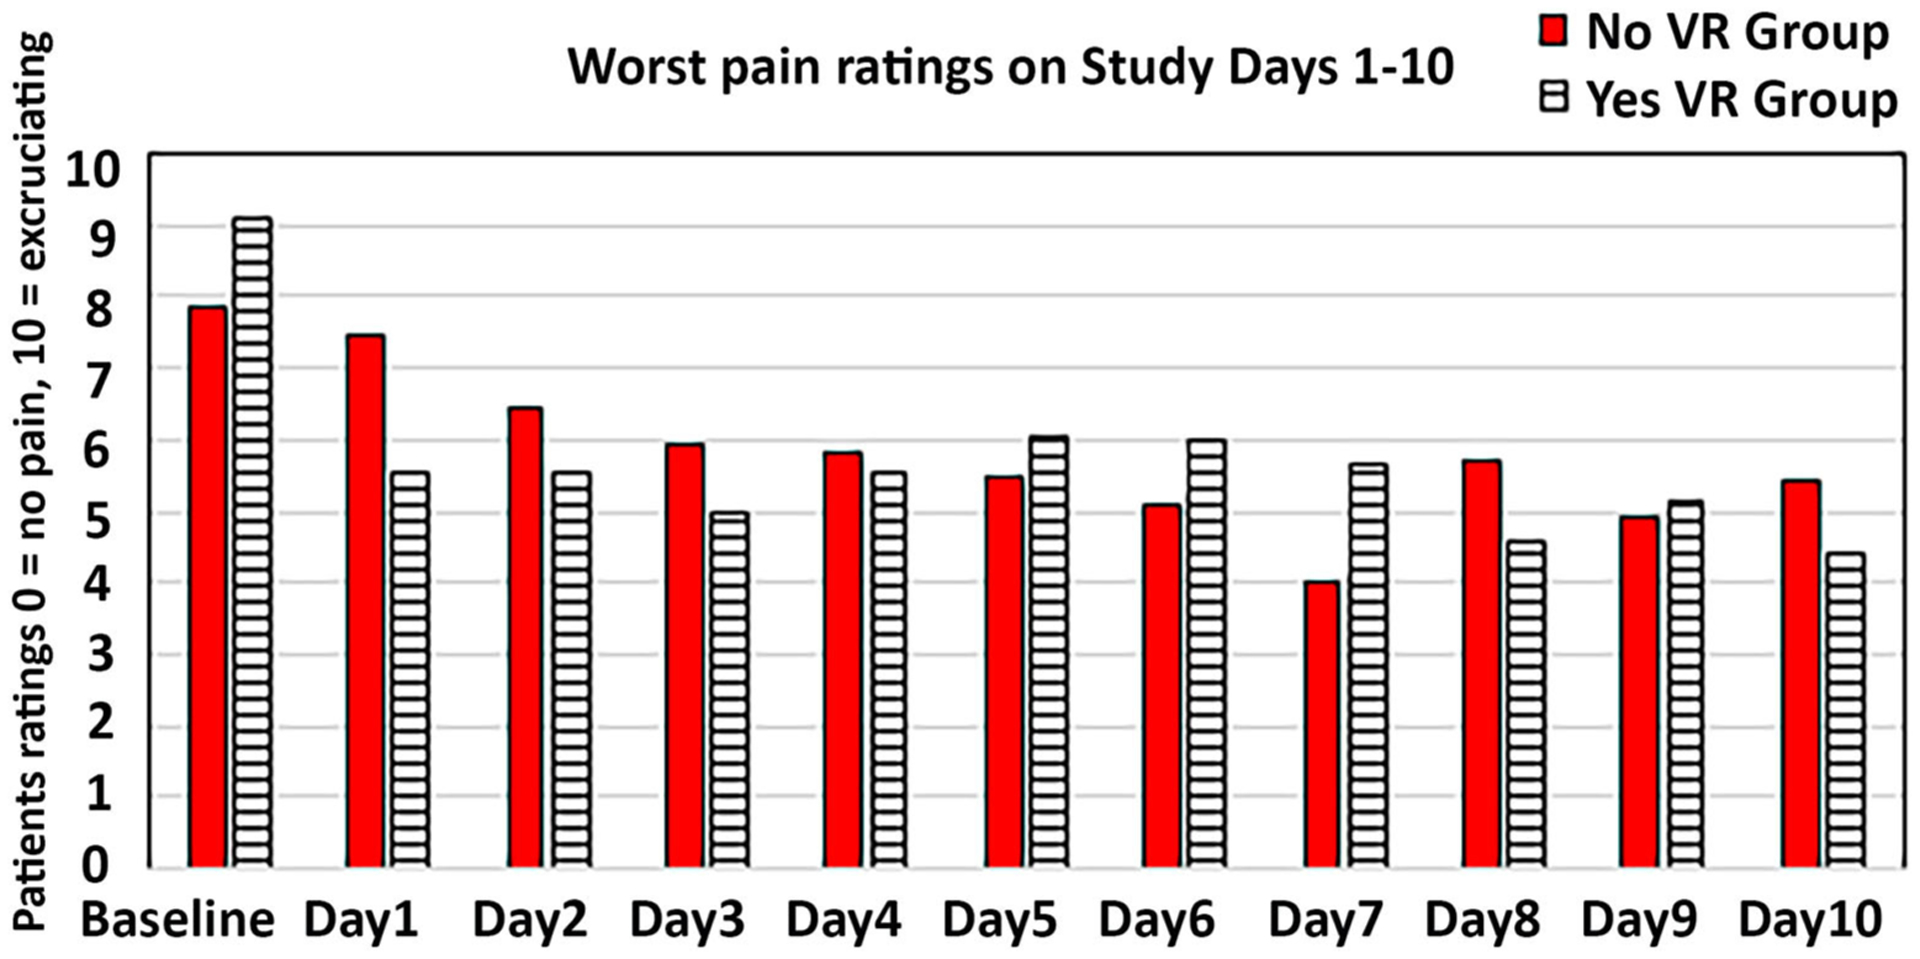
A graph showing worst pain ratings during baseline, and Study Days 1–10, for the VR Group vs. the No VR Control Group. Note that all patients received No VR during wound care on the baseline day.

A graph showing worst pain ratings during baseline, and Study Days 1–10, for the VR Group vs. the No VR Control Group. Note that all patients received No VR during wound care on the baseline day.