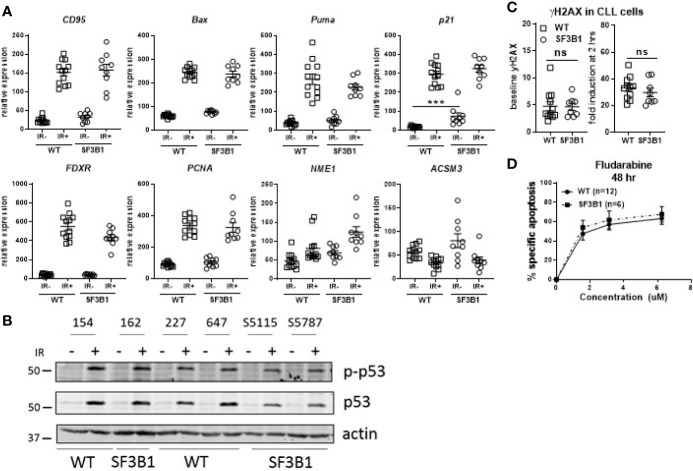
Figure 1.
Analysis of DDR response in treatment-naïve SF3B1-mutated CLL cells. (A) Results of RT-MLPA with specific probes for the detection of ATM/p53 target genes. Relative expression is shown of treatment-naïve SF3B1wt (WT, n = 12) and SF3B1mut (SF3B1, n = 9) primary CLL cells -/+ IR (5Gy) and 16 h culturing. Data is represented as mean ± SEM. Significance was determined by Kruskal-Wallis test with Dunn’s multiple comparison post hoc analysis, ***p < 0.001. (B) Effects of IR (5Gy) followed by 16 h culturing on p-p53, p53, and β-actin measured by western blotting. (C) Formation of γH2AX measured by flow cytometry at baseline (left) and after irradiation (5Gy) and 2 h incubation (right). Data were normalized for isotype control and represented as mean ± SEM. ns, not significant. (D) CLL cells of SF3B1wt (n = 12) and SF3B1mut (n = 8) patients were treated with different concentrations of fludarabine as indicated. Cell death was assessed by DIOC6/TO-PRO-3 staining and calculated as described in material and methods. Error bars are ± SEM. No significant differences were observed (Mann-Whitney).

