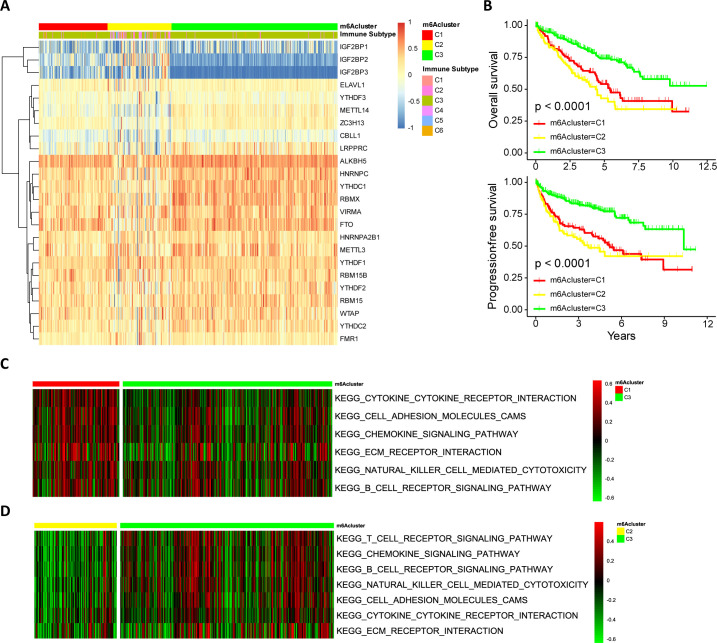
Figure 2.
m6A modification patterns in ccRCC and biological characteristics of m6A subtypes. (A) Model-based clustering of ccRCC yields three subtypes in the TCGA-KIRC dataset. C1, cluster1; C2, cluster2; C3, cluster3. (B) Comparison of prognosis among ccRCC subtypes (Kaplan-Meier analysis). (C, D) The heatmap depicted the activation states of biological processes (evaluated by GSVA) among m6Aclusters, and activated and inhibited biological processes were marked with red and green, respectively. (C) m6Acluster-C1 vs m6Acluster-C3; (D) m6Acluster-C2 vs m6Acluster-C3. ccRCC, clear cell renal cell carcinoma; GSVA, gene set variation analysis; m6A, N6-methyladenosine.

