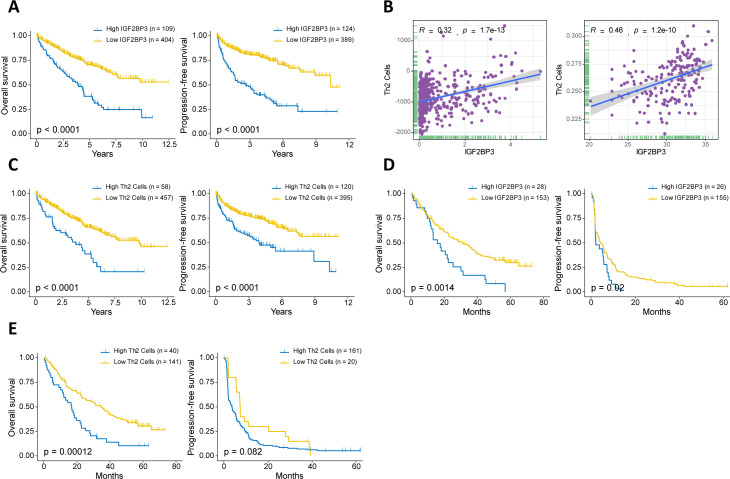
Figure 4.
Relationship between the expression of m6A regulators and immune cell infiltration. (A) Kaplan-Meier curves for patients with high or low IGF2BP3 expression in the TCGA-KIRC cohort. (B) The correlation between IGF2BP3 and the infiltration of Th2 cell in the TCGA-KIRC cohort (Left) and anti-PD-1 therapy cohort (Right). (C) Kaplan-Meier curves for patients with high or low Th2 cell infiltration in the TCGA-KIRC cohort. (D, E) Kaplan-Meier curves depicted the survival differences between patients with high and low IGF2BP3 expression (D) and Th2 cell infiltration (E) in the anti-PD-1 therapy cohort. m6A, N6-methyladenosine.

