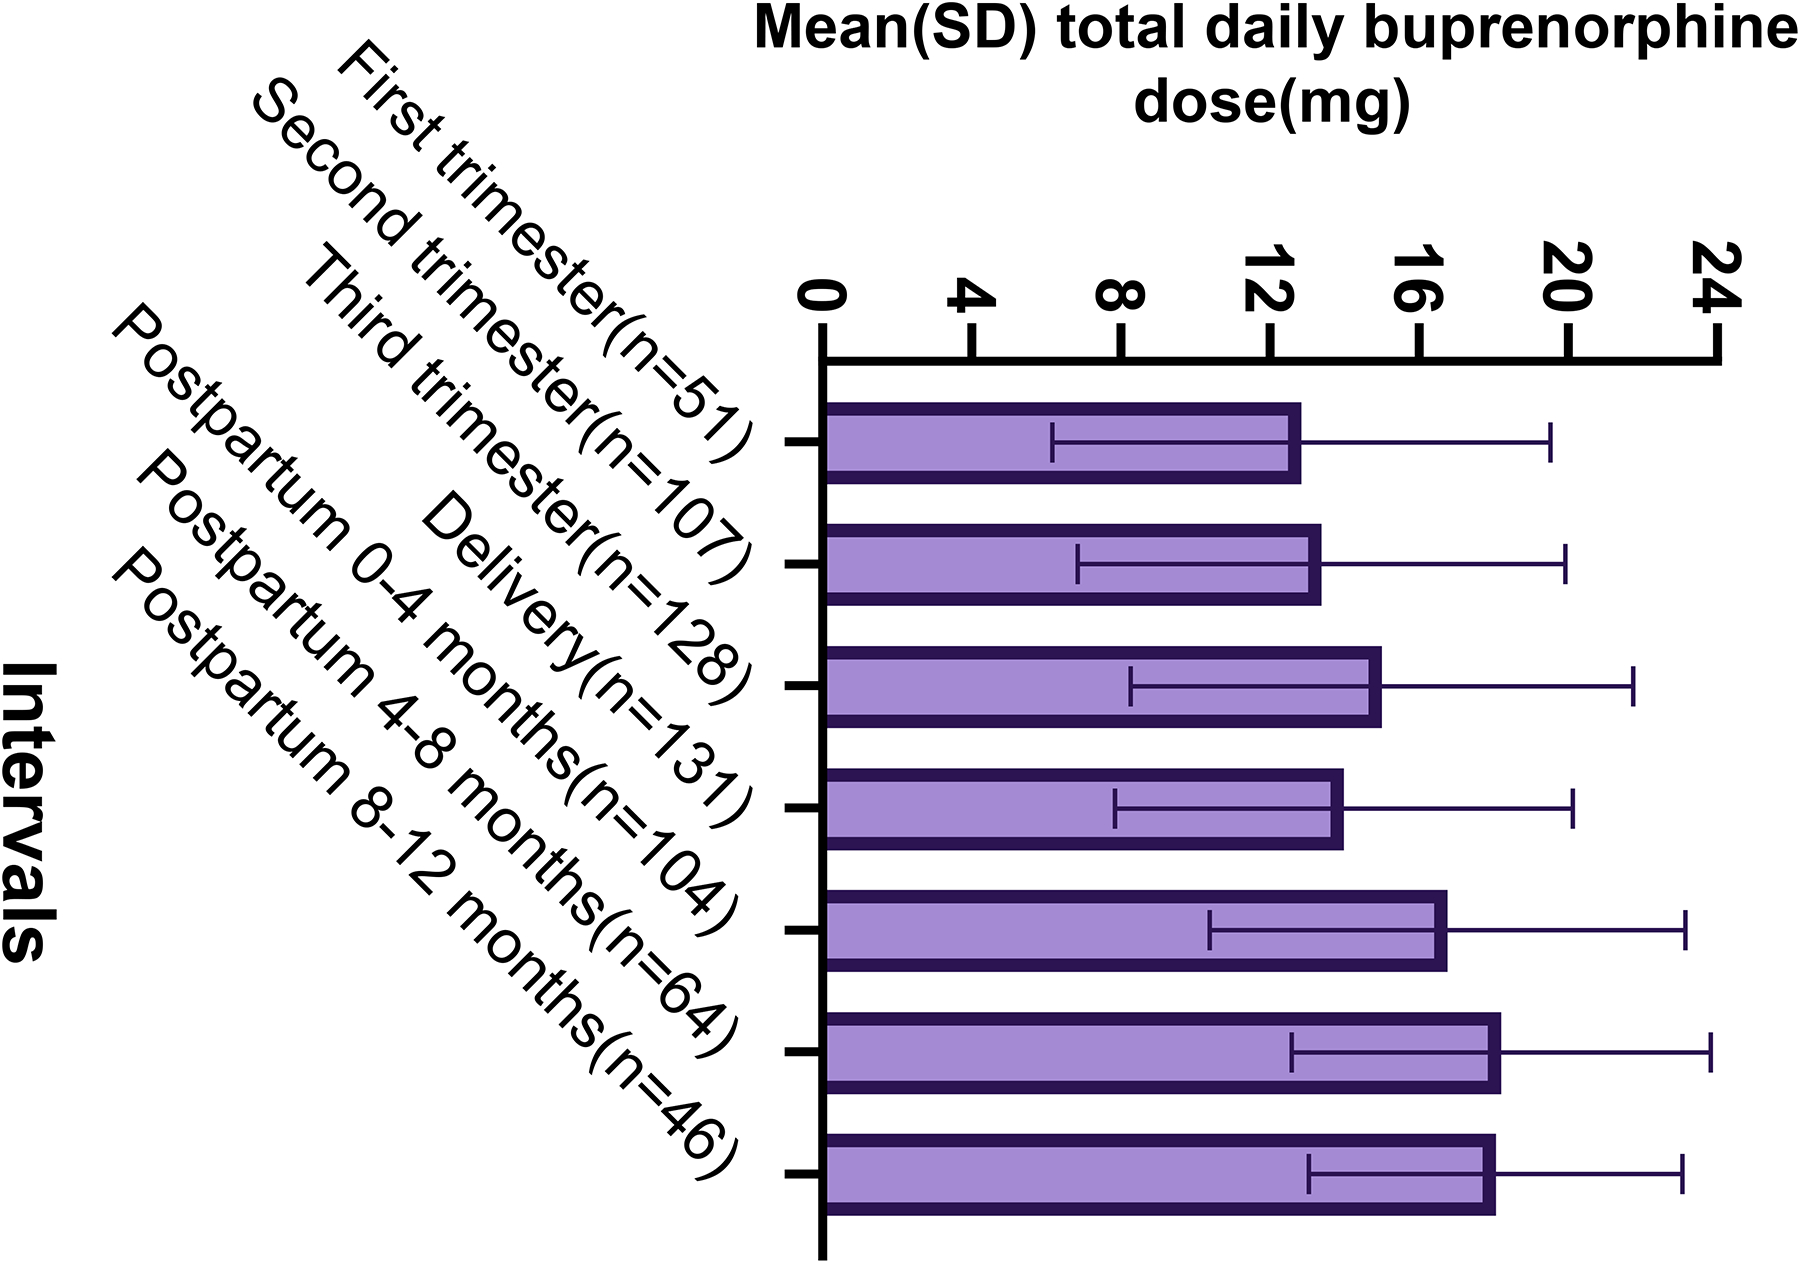
Fig. 3.

Bar graph of mean (SD; standard deviation) buprenorphine total daily dose through the perinatal period by perinatal time interval among the study population (N=240) demonstrating a steady increase in the mean total daily dose of the groups providing data for each pregnancy trimester, a slight decrease in the group mean dose at the time of delivery, followed by again an increase in the mean total daily dose of the groups providing data for the postpartum time periods.
