Fig. 5.

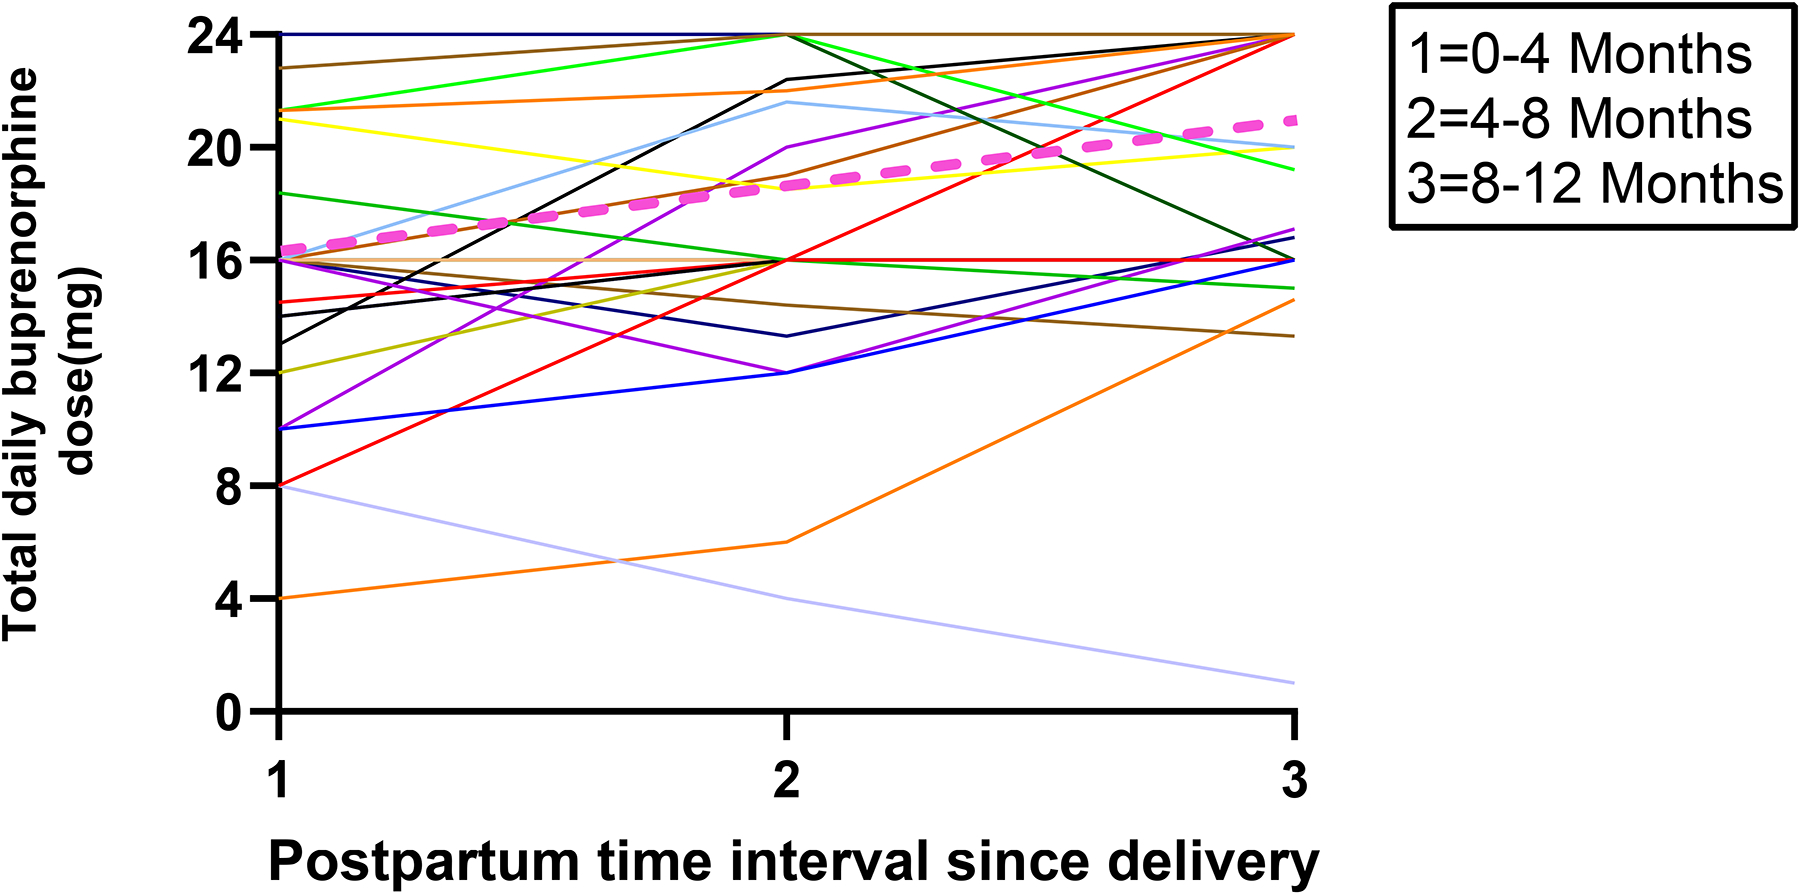
Spaghetti plot of individual trajectories in mean buprenorphine total daily dose for each postpartum time interval represented in various colors with the mean represented by pink dashed line (N=32)

Spaghetti plot of individual trajectories in mean buprenorphine total daily dose for each postpartum time interval represented in various colors with the mean represented by pink dashed line (N=32)