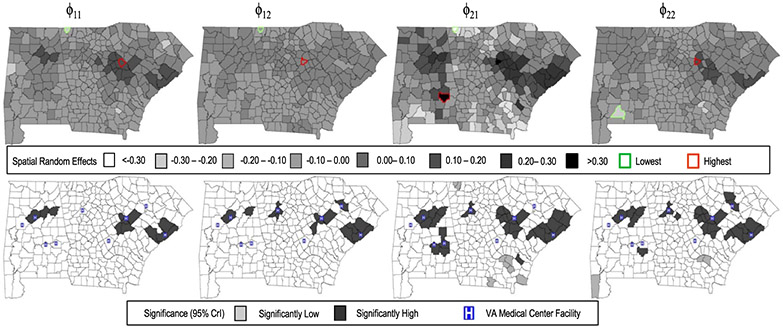
Figure 3:
County maps of predicted spatial random effects (top panel) and posterior significance (lower panel) for the VA inpatient study. From left to right, the maps correspond to the random intercepts and slopes for the binary component, and the random intercepts and slopes for the count component. For lower panel, dark gray denotes significantly high random effect, light gray denotes significantly low, and white denotes non-significant.

