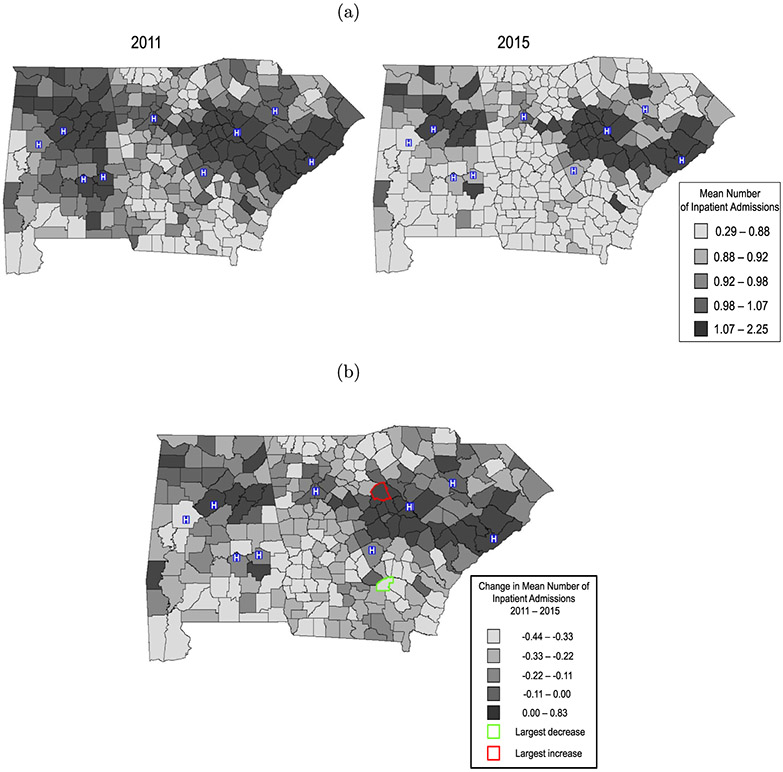
Figure 4:
Panel (a): Predicted per-patient admissions by county. Panel (b): Change in mean number of admissions per patient from 2011–2015. Both figures correspond to a patient in the reference covariate group. In Figure (b), the darkest shade shows counties with net increase in admissions. “H” denotes VA medical center.

