
Figure 7.
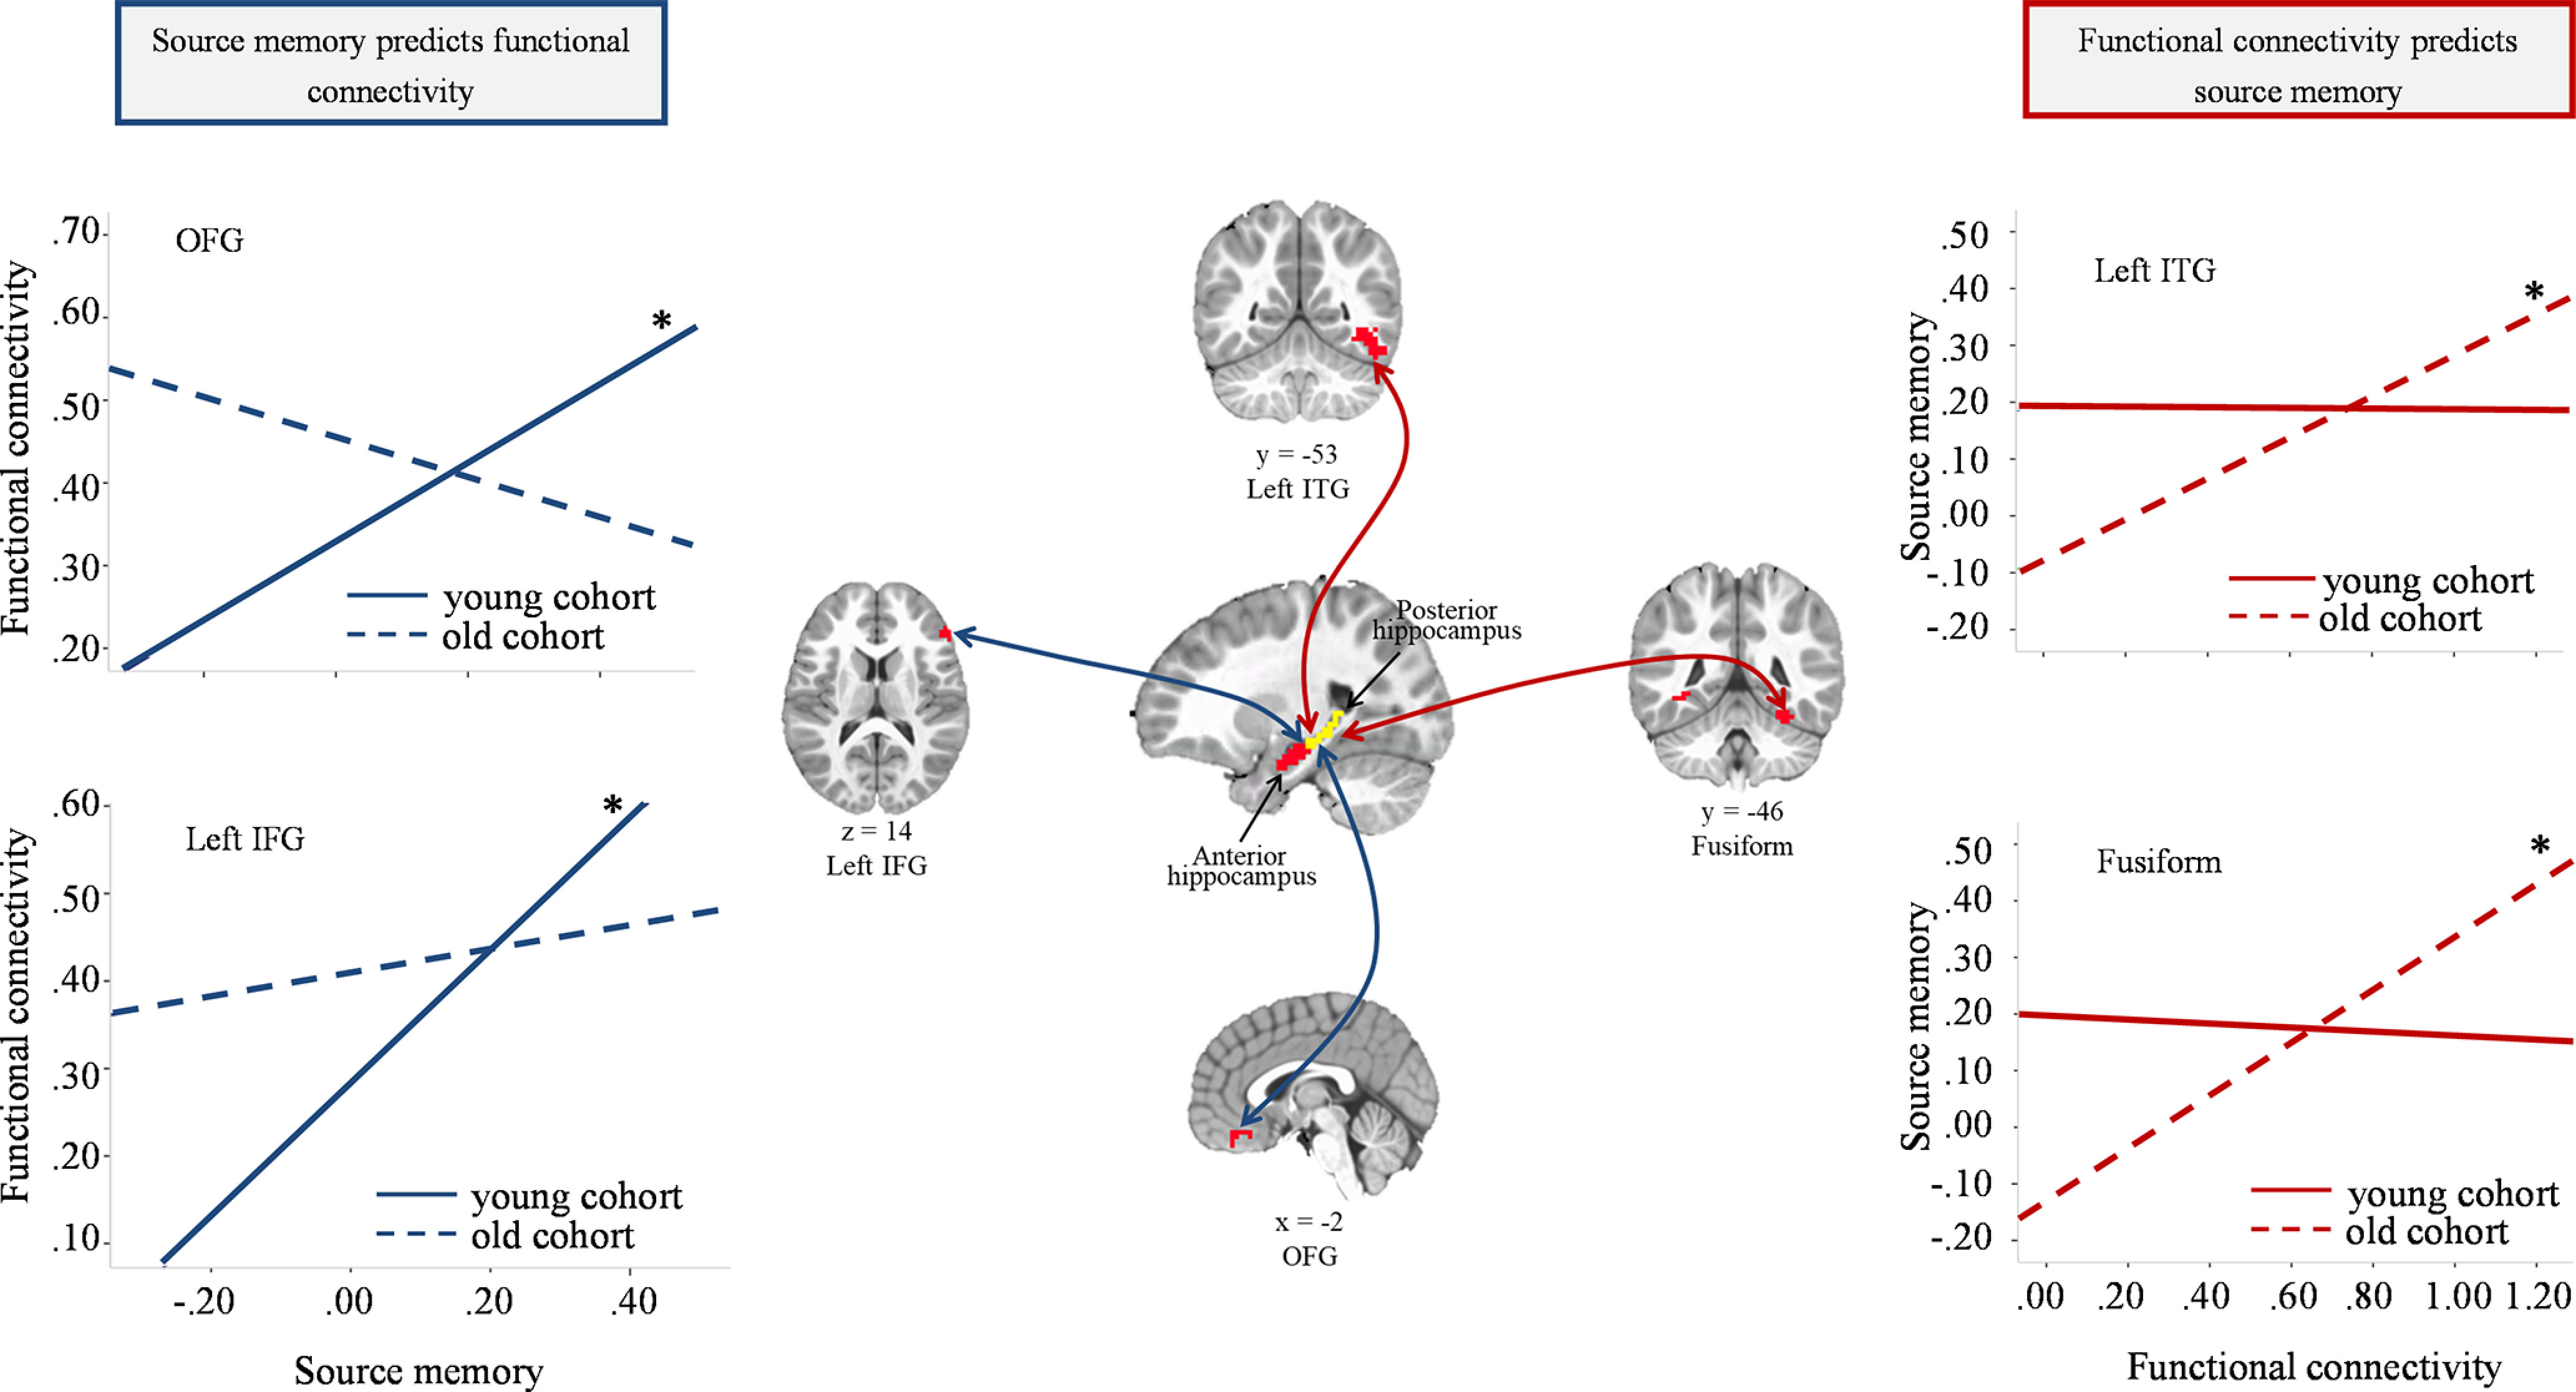
Plots represent associations between source memory changes and iHFC for each cohort from analyses showing significant interactive effects. *p < 0.01.
Official websites use .gov
A
.gov website belongs to an official
government organization in the United States.
Secure .gov websites use HTTPS
A lock (
) or https:// means you've safely
connected to the .gov website. Share sensitive
information only on official, secure websites.
Plots represent associations between source memory changes and iHFC for each cohort from analyses showing significant interactive effects. *p < 0.01.