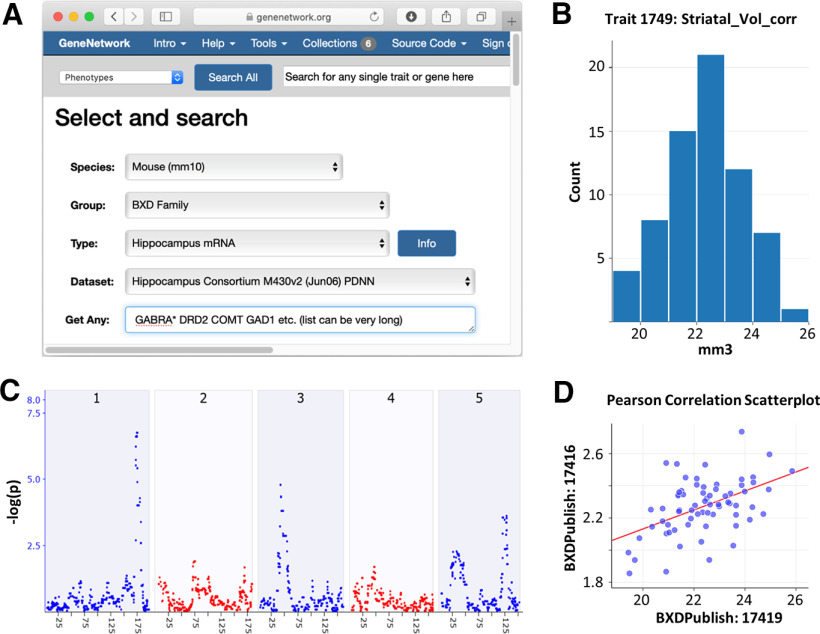
Figure 5.
Example workflow in GeneNetwork.org. A, The pull-down menus and global search fields are used to find phenotype or expression datasets, in this case related to gene expression in the hippocampus of the large BXD family. B, Histogram of the bilateral volume of the striatum for 68 different genotypes of mice (n = ∼6/genotype. C, Map of the chromosomal regions that control striatal volume, with linkage peaks on chromosome 1 at 173 Mb in the Qrr1 region (Mozhui et al., 2008), and on chromosomes 3 and 5. The x-axis lists positions along the first five chromosomes on a megabase scale. The y-axis gives linkage p values on a logarithmic scale with a peak of 6.73 at marker rs31612847. D, A get command can be used to probe the relationship between volume and neuron number, which reveals a Pearson r value of 0.49, demonstrating that volume differences explain ∼25% of the heritable differences in numbers of neurons—primarily medium spiny neurons—in mouse striatum.

