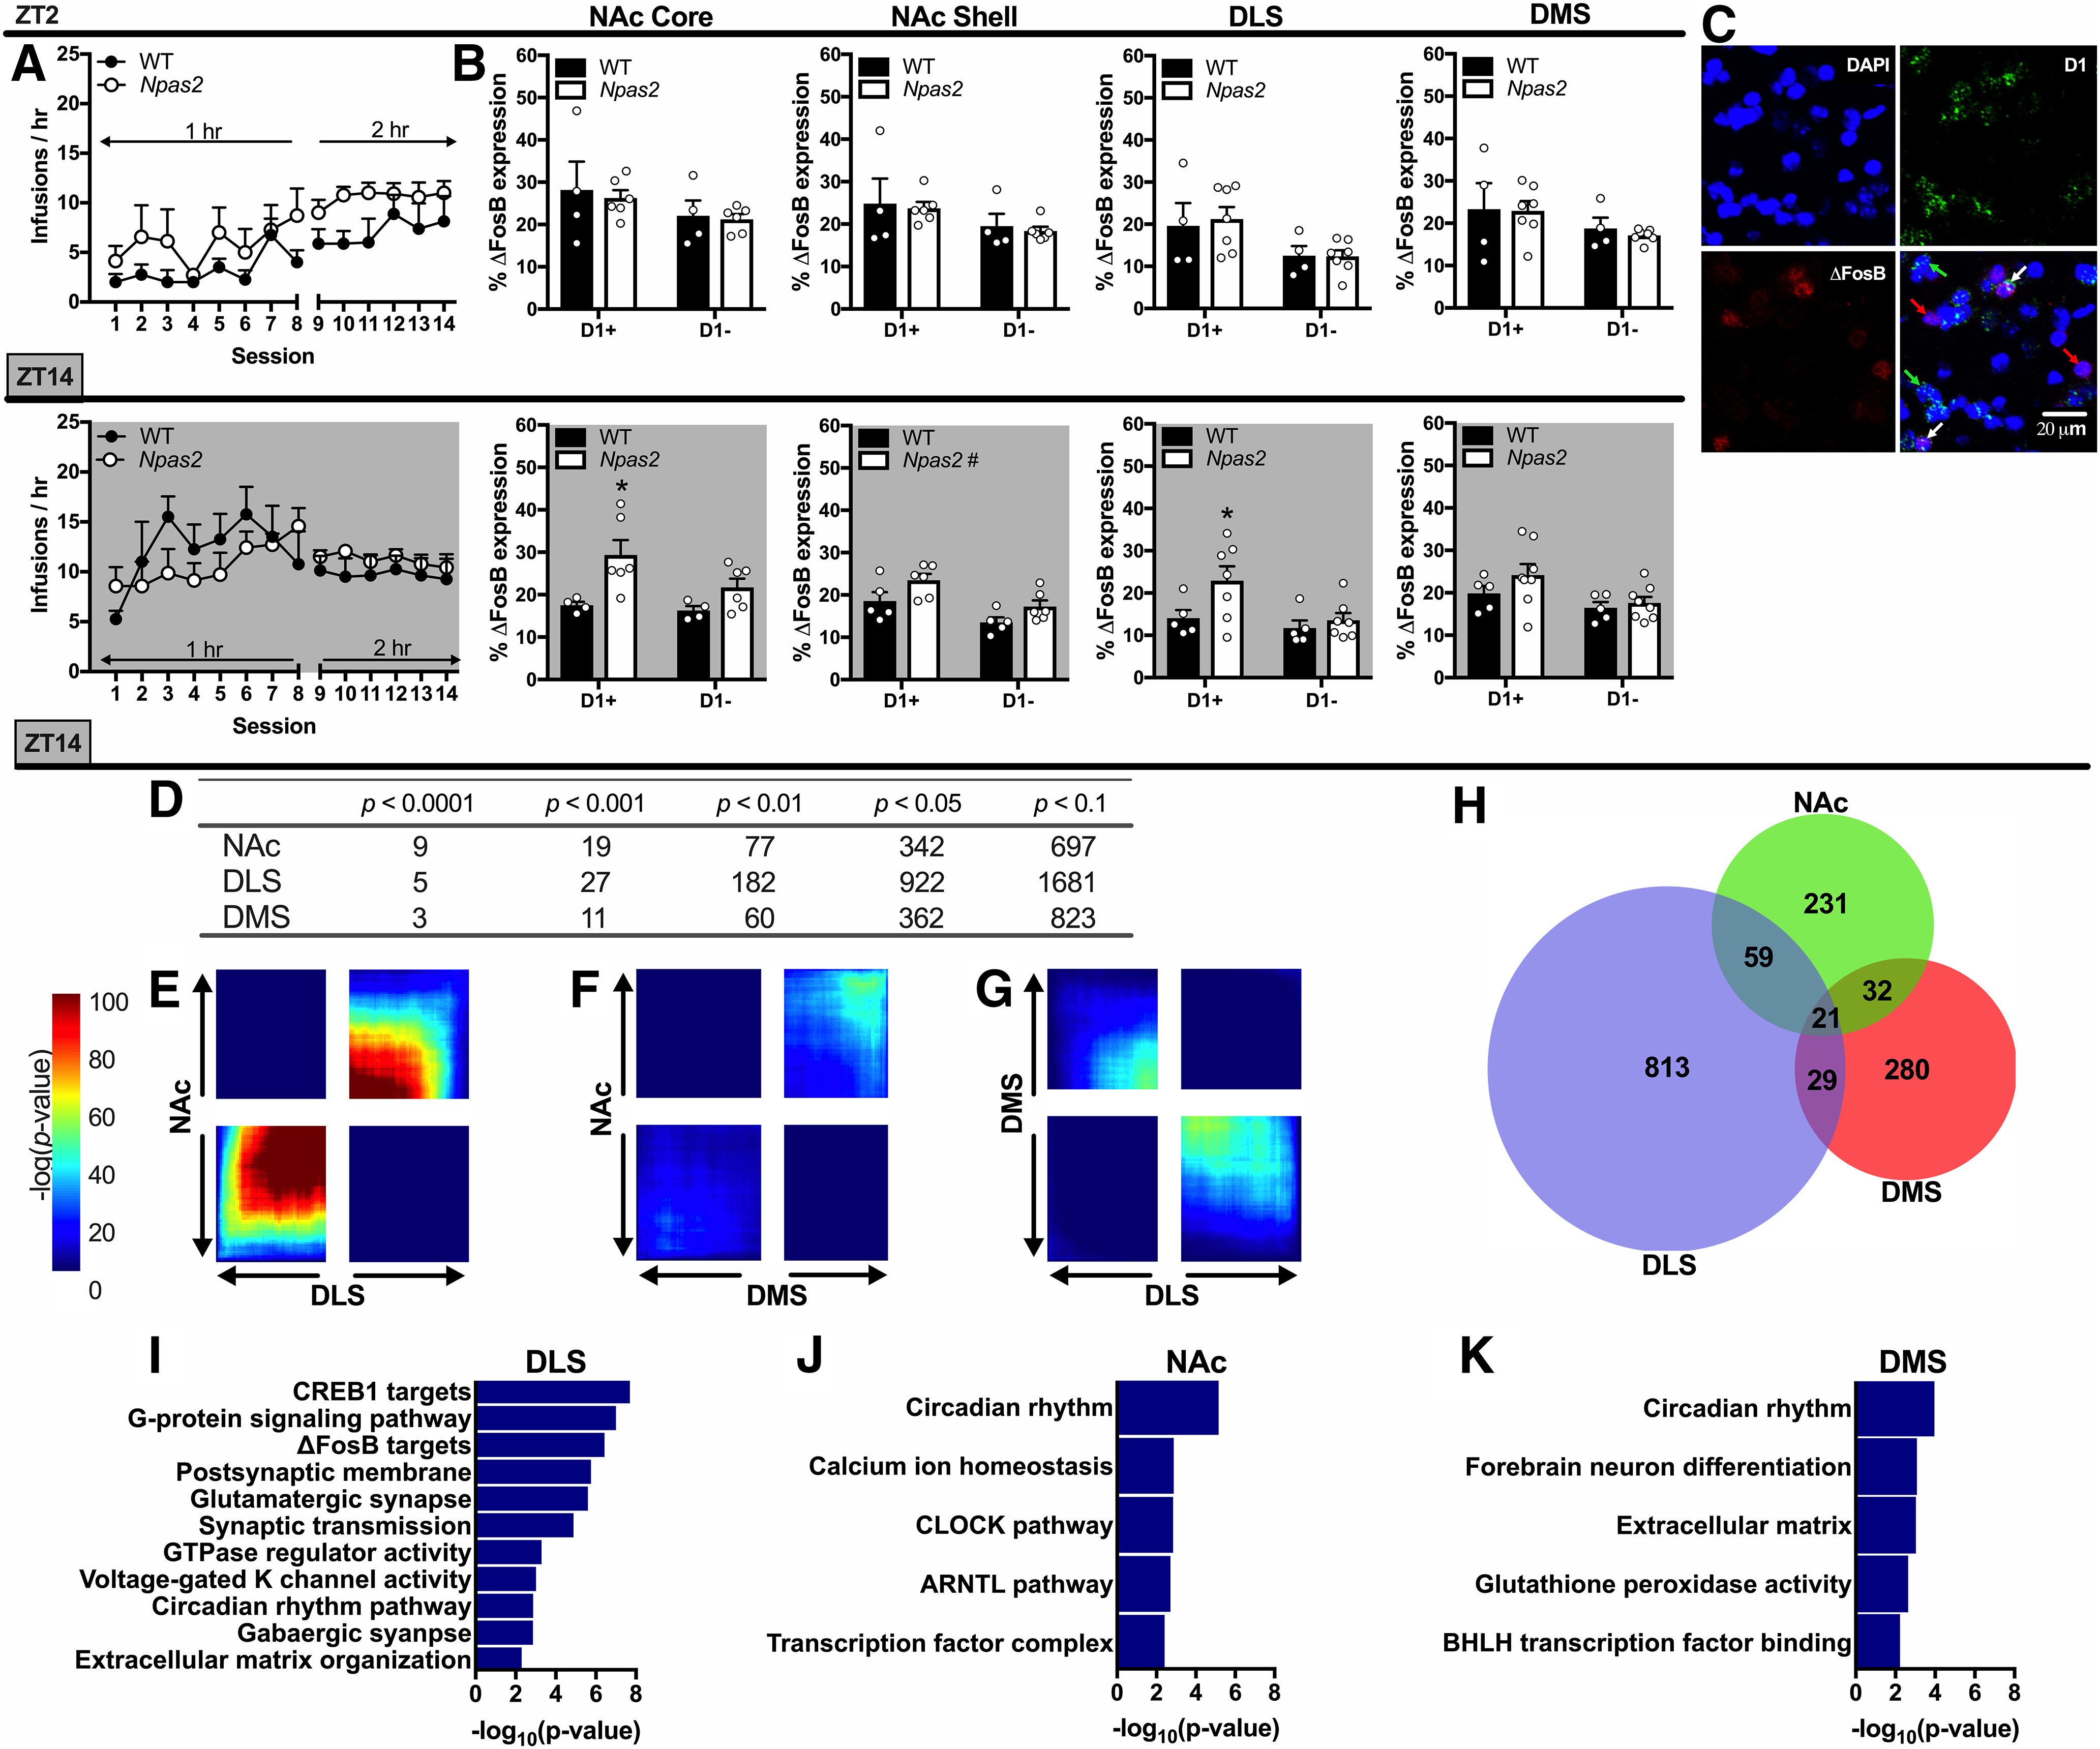
Figure 9.

Striatal activation and differential gene expression in Npas2 mutant females in the dark phase. A, A cohort of female mice were trained to self-administer cocaine during either the light phase or dark phase. Infusions were limited to 25 to normalize cocaine intake between groups. B, No differences were found between genotypes in ΔFosB expression following light phase cocaine self-administration. However, following dark phase, self-administration ΔFosB expression was increased in Npas2 mutant females in the NAc core, shell, and DLS. This expression was specific to D1+ cells in the NAc core and DLS. Throughout, cocaine-induced ΔFosB expression was greater in D1+ compared to D1– cells. C, Representative staining is shown with the nucleus (DAPI, blue), D1 (green), and ΔFosB (red) shown individually and as a composite image with 20-µm scale bar shown. D, Table showing the cumulative number of DE genes between Npas2 mutant and WT female mice in the dark phase with a FC cutoff of 1.3. Various significance cutoffs are shown for the NAc, DLS, and DMS. E–G, RRHO plots showing various levels of overlap between genes that are changed with Npas2 mutation in the NAc, DLS, and DMS. E, There is a high level of overlap between genes that are changed in the NAc and DLS, while (F) very few genes are changed in both the NAc and DMS of Npas2 mutants. G, Genes in the DMS and DLS are changed in opposite directions in Npas2 mutant females. H, Venn diagram showing unique or overlapping DEGs in the NAc, DLS, and DMS with a cutoff of p < 0.05 and FC = 1.3. I–K, Highly significant pathways altered in Npas2 mutant females in the DLS, NAc, and DMS are shown. Extended Data list DEGs in the NAc (Extended Data Fig. 9-1), DLS (Extended Data Fig. 9-2), and DMS (Extended Data Fig. 9-3). Mean + SEM; individual data points are shown in B, #p < 0.1, *p < 0.05, n = 4–8.
