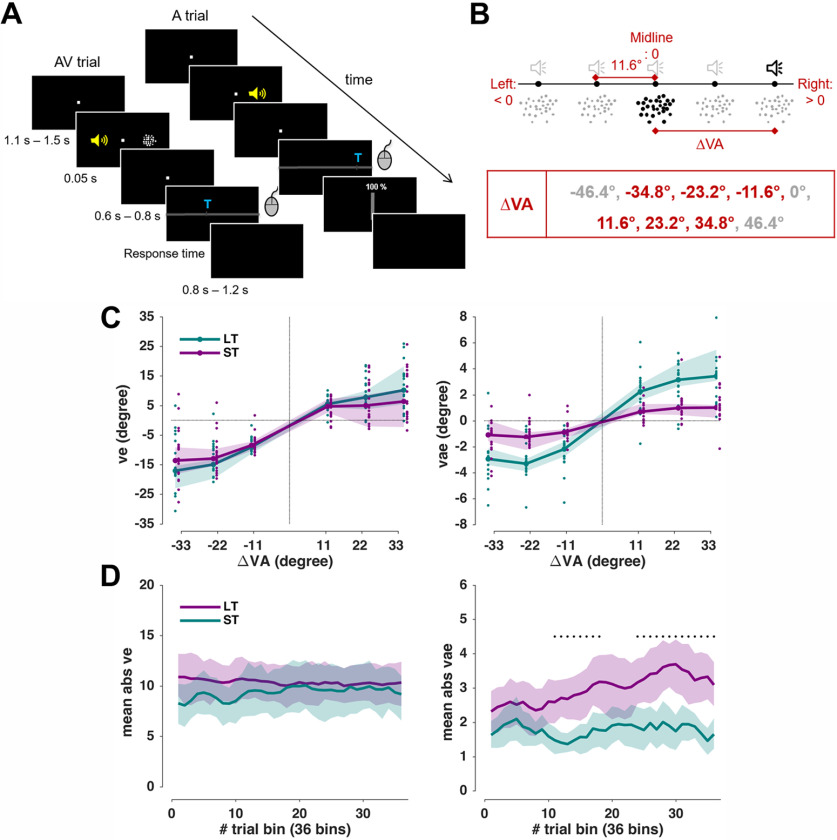
Figure 1.
Experiment setup and behavioral data. A, Example sequence of AV and A trials (rare V trials are not shown). The yellow speaker is for illustration only; the sound came from speakers placed behind the screen. The participants submitted their response by moving a mouse cursor to the location where they perceived the sound. The confidence rating was only taken in the A trial. B, ΔVA is the distance between the visual and sound stimuli, each located at one of five horizontal locations. Among the nine possible values of ΔVA, only six were used for efficiency. C, Behavioral results: the ventriloquism effect (left) and ventriloquism aftereffect (right), both median values across participants (n = 19); the shaded areas are 95% confidence intervals around the median. Dots show individual participant's data. D, Temporal progression of biases. Shaded areas indicate 95% hybrid bootstrap confidence intervals around the mean. Black dots denote a significant difference between the LT and ST tested with a cluster-based permutation test (p < 0.01; for details, see Materials and Methods). ve: trial-wise ventriloquism effect. vae: trial-wise ventriloquism aftereffect. LT: long-term paradigm. ST: short-term paradigm.

