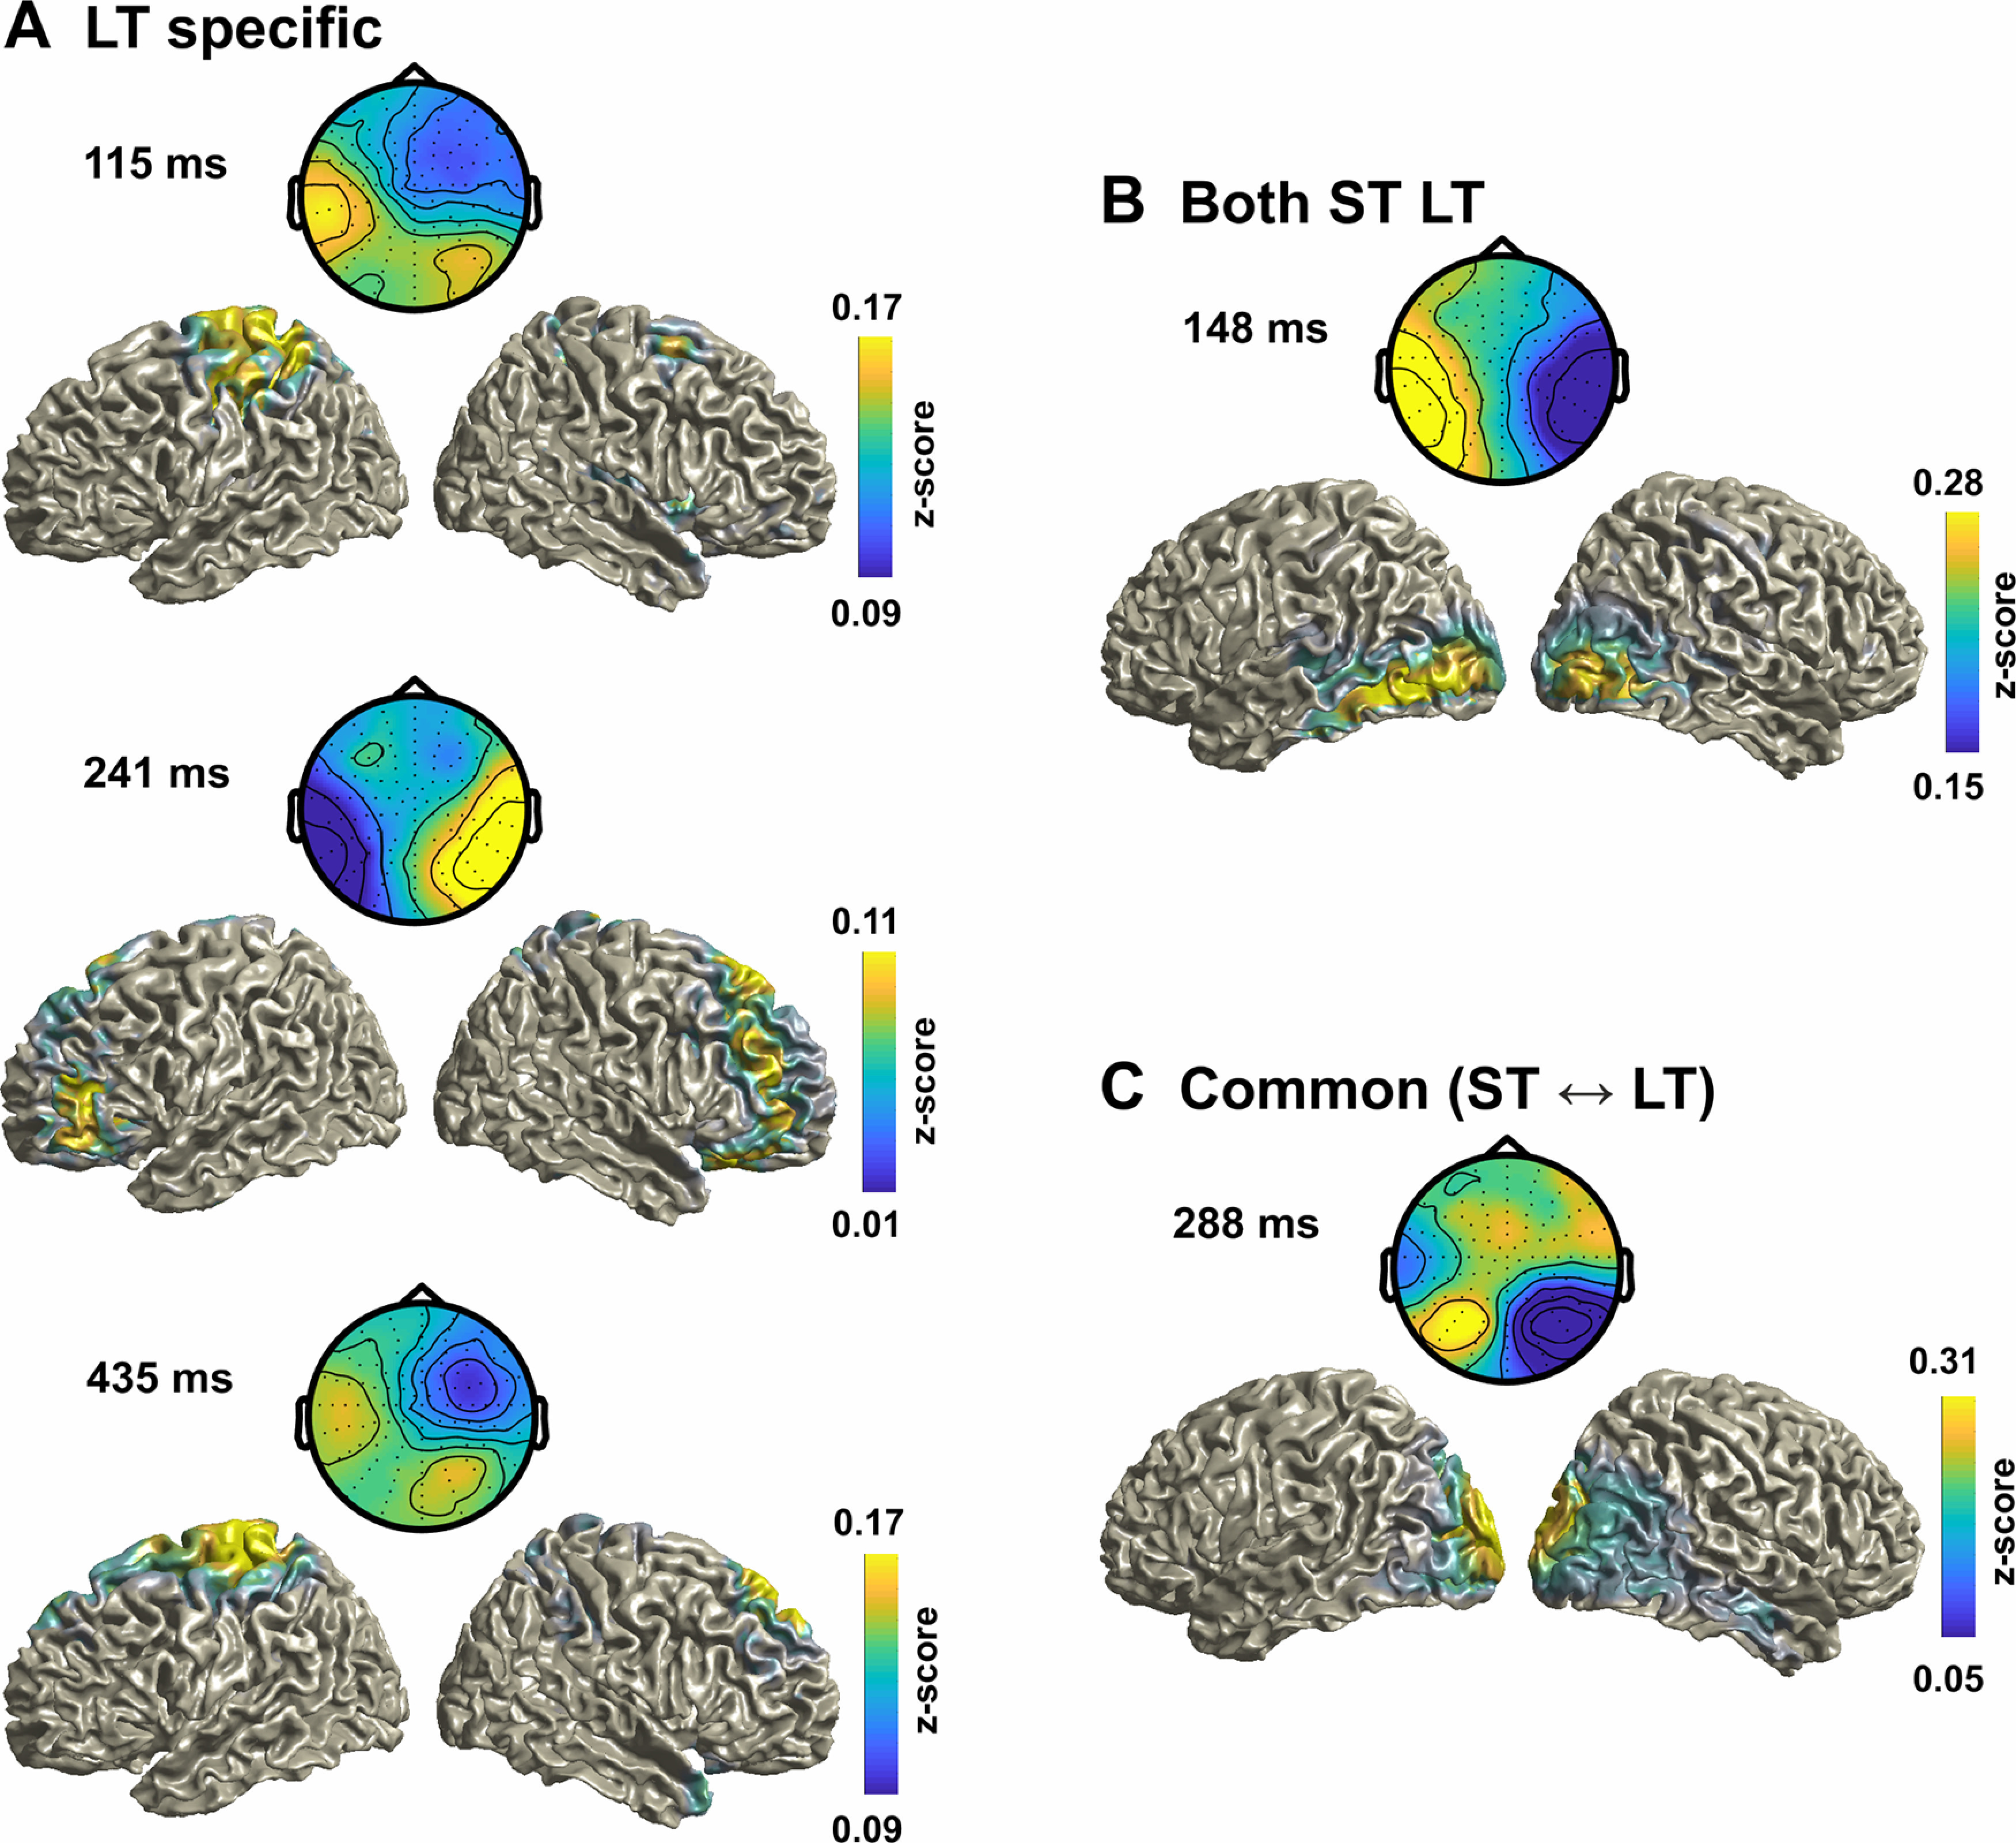
Figure 3.

EEG topographies and source maps for the LDA-ΔVA classifier. A, Group-averaged topographies (forward models) and source maps for the three LT-specific time points derived in Figure 2C, left. B, C, Time point common to both paradigms (Fig. 2C, right; B), and for the peak time point in the cross-paradigm analysis in Figure 2D (C). The data are shown as z score-transformed correlations between single trial source activity and the LDA output (see Materials and Methods). For B and C, the correlations were averaged across paradigms.
