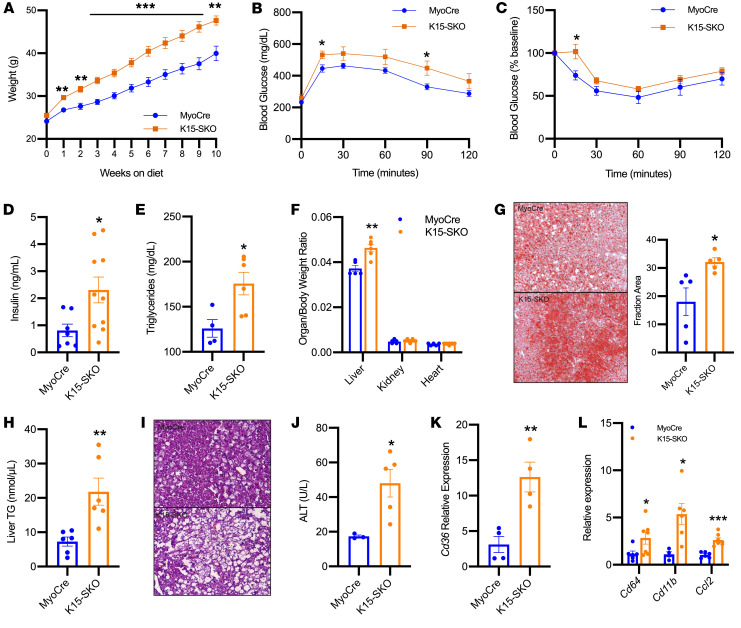
Figure 2. K15-SKO mice exhibit exacerbated metabolic disease phenotype with HFD.
(A) Body weight (g) of animals on HFD starting from 8 weeks of age (n = 9–13). (B) IPGTT (n = 7–8). (C) IPITT at 10 weeks on HFD (n = 6–7). (D) Plasma insulin levels (n = 6–7). (E) Plasma triglyceride levels (n = 4–6). (F) Organ to body weight ratio of liver, kidney, and heart (n = 5–6). (G) Representative images of liver ORO staining in MyoCre vs. K15-SKO mice on HFD and quantification of proportional area of positive staining. (H) Liver tissue TG (n = 6–8). (I) Representative images of H&E-stained liver sections of MyoCre vs. K15-SKO mice. (J) Plasma alanine transaminase (ALT) concentration (n = 3–5). (K) Liver Cd36 expression (n = 4). (L) Expression of various inflammatory genes in liver tissue (n = 6–7). All animals were on HFD for 10 weeks unless otherwise indicated. Data represent mean ± SEM. Comparisons between MyoCre and K15-SKO mice were performed using an unpaired, 2-tailed Student’s t test, *P < 0.05, **P < 0.01, ***P < 0.001.

