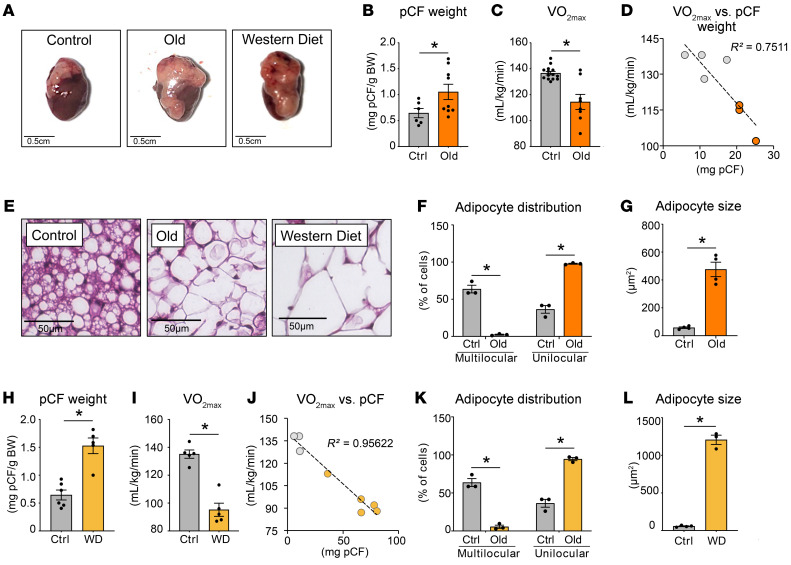
Figure 1. pCF is a unique fat depot that expands with aging and obesity.
(A) Representative images of pCF on top of hearts from control diet–fed (6 months old), control diet–fed old mice (20 months old), and Western diet–fed mice (6 months old; 12 weeks on a Western diet). Scale bars: 0.5 cm. (B) pCF weight normalized to BW, (C) maximal oxygen consumption (VO2max) during graded maximal exercise testing, and (D) relationship between VO2max and the amount of pCF for control (Ctrl) and old animals. (E) Representative H&E-stained images of the pCF depot from control, old, and Western diet–fed mice. Scale bars: 50 μm. (F) Distribution of multilocular and unilocular adipocytes and (G) unilocular adipocyte size for control and old animals. (H) pCF weight normalized to BW, (I) VO2max during graded maximal exercise testing, and (J) relationship between VO2max and the amount of pCF for control diet–fed and Western diet–fed (WD) animals. (K) Distribution of multilocular and unilocular adipocytes and (L) unilocular adipocyte size for control and Western diet–fed animals. For pCF weight and exercise testing, n = 5–14 per biological animal replicate. For adipocyte quantifications, n = 75–150 for a given biological replicate for adipocyte size and n = 150–275 for adipocyte numbers for a given biological replicate, and n = 3–4 biological replicates per genotype. Data are presented as the mean ± SEM or by dot plot with linear regression. P = 0.05, by Student’s t test.

