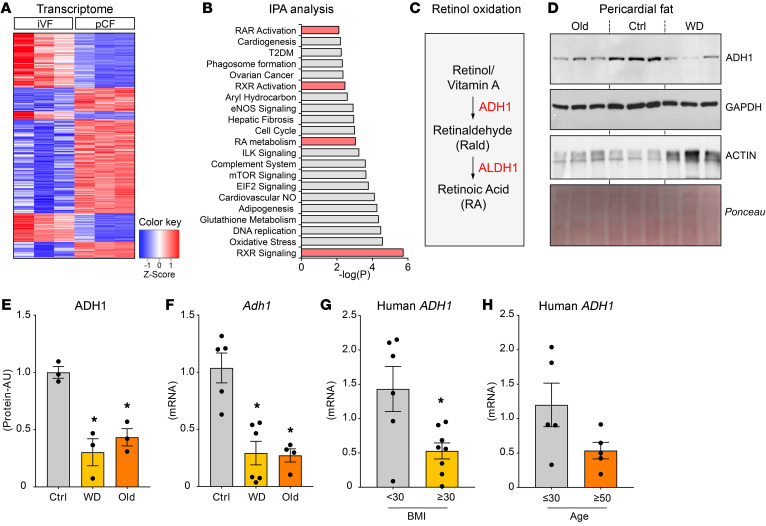
Figure 2. Importance of Adh1 expression for pCF biology.
(A) Heatmap and (B) the top most significantly regulated canonical pathways determined by IPA from a list of 1023 genes that were differentially regulated between WT iVF and pCF using the Affymetrix transcriptome array. (C) Schematic of the retinol oxidation pathway. (D) Western blot and (E) quantification of ADH1 expression normalized to GAPDH and β-actin in the pCF depot of control, old, and Western diet–fed mice. (F) qPCR analysis of Adh1 expression in the pCF depot of control, old, and Western diet–fed mice. (G) qPCR analysis of ADH1 expression in the pCF depot of humans with a BMI below 30 or a BMI of 30 or higher. (H) qPCR analysis of ADH1 expression in the pCF depot of humans aged 30 years or younger and 50 years or older. n = 3 per group for biological animal replicates in the Western blot; n = 4–6 per group for biological animal replicates for qPCR analysis; n = 5 for samples from young and old humans; n = 6–8 for samples from lean and obese humans. Data are presented as the mean ± SEM. *P = 0.05, by Student’s t test for comparisons between 2 groups for human data, or by 1-way ANOVA with Tukey’s HSD multiple-comparison test for comparison of the mean of Western diet–fed mice and old mice with the mean of the control group.

