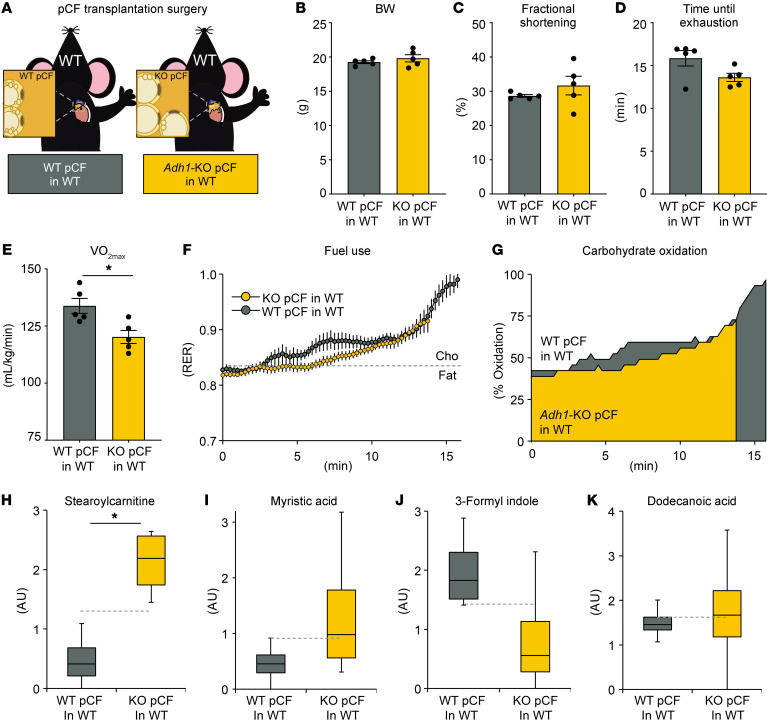
Figure 5. pCF transplantation recapitulates the Adh1-KO phenotype.
(A) Representative schematic of pCF transplantation surgeries. (B) BW and (C) echocardiographic percentage of fractional shortening for 4-month-old WT mice transplanted with WT pCF or Adh1-KO pCF. (D) Time until exhaustion and (E) VO2max during graded maximal exercise testing. (F) RER during graded maximal exercise testing of WT mice that received WT pCF or Adh1-KO pCF transplants. (G) Carbohydrate oxidation during graded maximal exercise testing for WT pCF and Adh1-KO pCF transplant groups. (D–K) Relative levels of the indicated metabolites in WT mice that received WT pCF or Adh1-KO pCF transplants. n = 5 per group for each biological replicate. Data are presented as the mean ± SEM for bar graphs, as dot plots indicating the mean over the course of a test, as 2D area charts for oxidation graphs, or as box-and-whisker plots. *P = 0.05, by Student’s t test.

