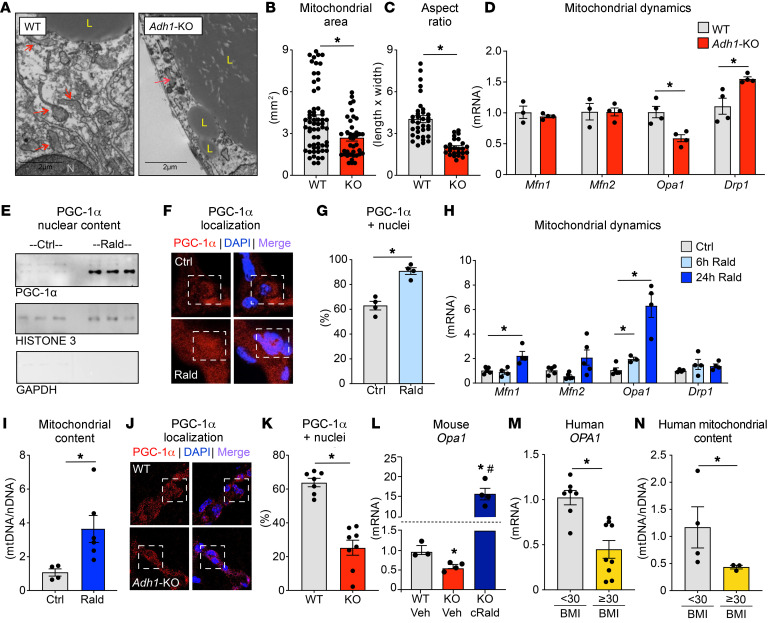
Figure 7. The ADH1/retinaldehyde pathway regulates pCF remodeling by altering mitochondria through PGC-1α.
(A) Representative TEM images of pCF from WT and Adh1-KO mice. L, lipid droplet; N, nucleus. Arrows indicate mitochondria. Scale bars: 2 μm. (B) Measurements of mitochondrial area and (C) aspect ratio from TEM images of pCF from WT and Adh1-KO mice. (D) qPCR for mitofusin 1 (Mfn1), mitofusin 2 (Mfn2), Opa1, and Drp1 mRNA expression in pCF. (E) PGC-1α protein expression in nuclear pCF extracts isolated from WT animals injected systemically with vehicle or retinaldehyde for 6 hours compared with expression in the nuclear protein loading control. (F) Immunofluorescence analysis of PGC-1α (red) in pCF from WT controls or mice treated for 6 hours with retinaldehyde and (G) quantification of PGC-1α–positive nuclei from the immunofluorescence images in F. Original magnification, ×400. (H) qPCR analysis of expression of the indicated genes in pCF following vehicle or retinaldehyde treatment for 6 hours or 24 hours. (I) qPCR analysis of mtDNA abundance in pCF following 24 hours of treatment with retinaldehyde or vehicle control in WT mice. (J) Immunofluorescence analysis of PGC-1α (red) in WT or Adh1-KO pCF and (K) quantification of PGC-1α–positive nuclei in immunofluorescence images of WT or Adh1-KO pCF. (L) qPCR analysis of Opa1 expression in the pCF depot from WT vehicle-treated, Adh1-KO vehicle-treated, and Adh1-KO chronic retinaldehyde–treated mice (1-month-long treatments). (M) qPCR analysis of OPA1 expression in the pCF depot of humans with a BMI below 30 or a BMI of 30 or higher. (N) qPCR quantification of relative mtDNA abundance normalized to nDNA content in the pCF depot of humans with a BMI below or above 30. n = 7–9 per group for human gene expression analysis; n = 3–4 for mitochondrial content measurements; n = 3–5 per group for mouse gene expression analysis; n = 4–6 per group for mouse mitochondrial content measurements; n = 4–8 per group for animal biological replicates for immunostaining quantification; and n ≥65 nuclei analyzed per biological replicate for TEM quantifications. Data are presented as the mean ± SEM for bar graphs. Data were analyzed by Student’s t test when comparing 2 groups or by 1-way ANOVA with Tukey’s HSD multiple-comparison test for comparisons of 3 groups. Asterisks indicate significance compared with the control group, and the pound symbol indicates significance between Adh1-KO vehicle-treated and Adh1-KO chronic retinaldehyde–treated groups at P = 0.05.

