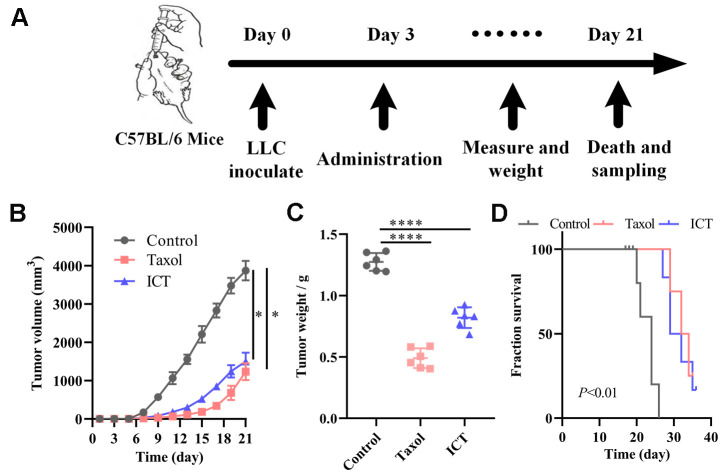
Figure 6.
ICT treatment inhibited tumor growth in mice. (A) In vivo experimental treatment plan flow diagram. (B) The tumor volume in control, positive control, and ICT- treated mice was measured once every two days using digital calipers. (C) Weight of LLC tumors following sacrifice in mice subjected to daily administered for 21 days, and their controls. (D) Kaplan-Meier survival curves of mice which were inoculated with LLC cells. All data represent the means ± SEM of six mice. *P < 0.05, ****P < 0.0001 vs control group.

