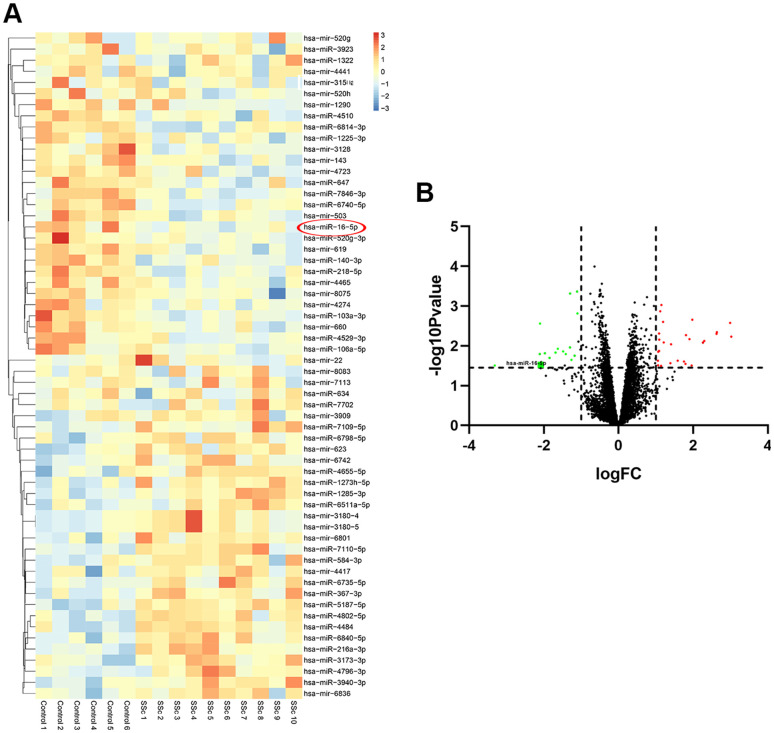
Figure 1.
Differentially expressed miRNAs in SSc patient samples compared to healthy controls. (A) The heat map shows hierarchical clustering of differentially expressed miRNAs in SSc patients compared to healthy controls (n=30 per group) in the GSE137472 dataset. (B) The volcano plot shows differentially expressed miRNAs in SSc patients compared to healthy controls (n=30 per group) in the GSE137472 dataset.

