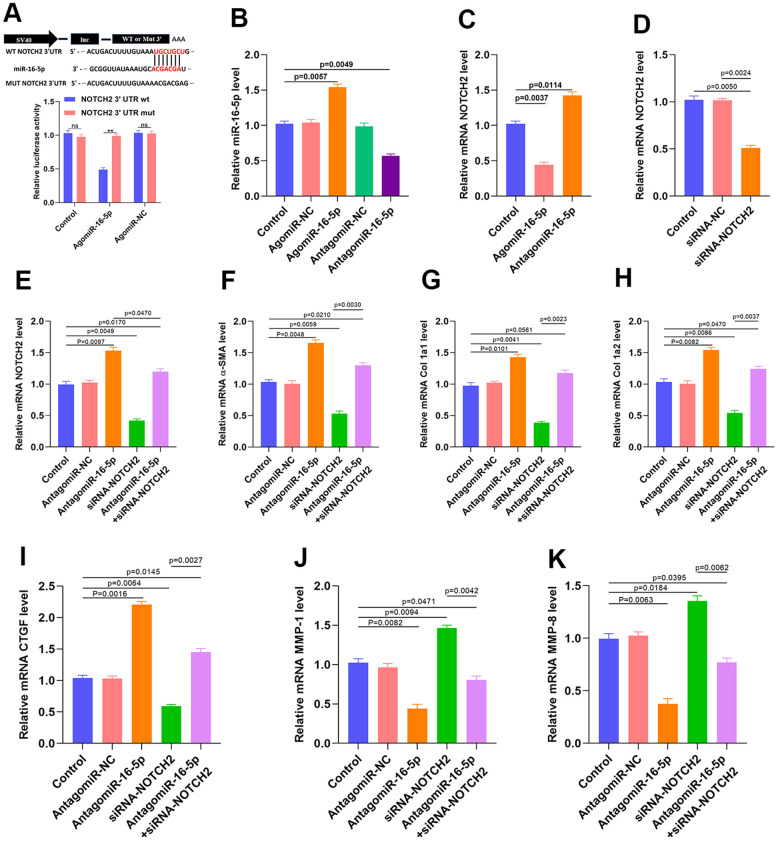
Figure 6.
Inhibition of miR-16-5p activates myofibroblasts. (A) Luciferase assay results. (B) miR-16-5p transfection rate was measured by qRT-PCR. (C) NOTCH2 expression in the different groups. (D) siRNA transfection rate was measured by qRT-PCR. (E–I) Levels of collagen-related markers were measured by qRT-PCR after different treatments in HSFs. (J, K) MMP levels in the different groups were measured by qRT-PCR. Data are shown as means ± SDs of three independent experiments.

