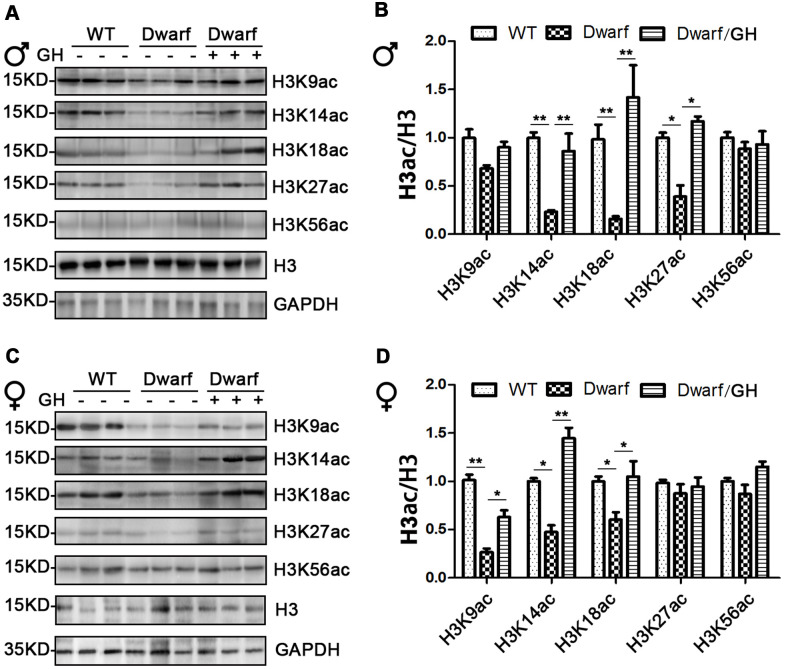
Figure 4.
Brain histone H3 acetylation altered in Ames dwarf mice upon early-life GH intervention. (A, C) Representative western blots in males (A) and females (C) mice upon early-life GH intervention. (B–D) Quantification of acetylation of histone H3 in males (B) and females (D). Protein quantification data (means ± SEM) are normalized to histone H3 and expressed as fold change compared with WT control (defined as 1.0), n=6 mice for each group. Data are means ± SEM. * p < 0.05, ** p < 0.01 by one-way ANOVA.

