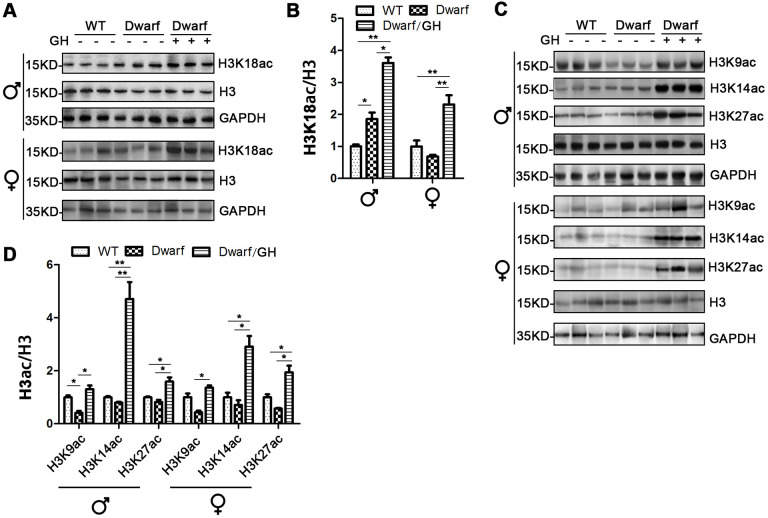
Figure 5.
Histone H3 acetylation changes in white adipose tissues of Ames dwarf mice upon GH intervention at early age. (A, C) Representative western blots in visceral adipose tissue (A) and subcutaneous adipose tissue (C) in mice upon early-life GH intervention. (B, D) Quantification of acetylation of histone H3 in visceral adipose tissue (B) and subcutaneous adipose tissue (D). Protein quantification data (means ± SEM) are normalized to histone H3 and expressed as fold change compared with WT control (defined as 1.0), n=6 mice for each group. Data are means ± SEM. * p < 0.05, ** p < 0.01 by one-way ANOVA.

