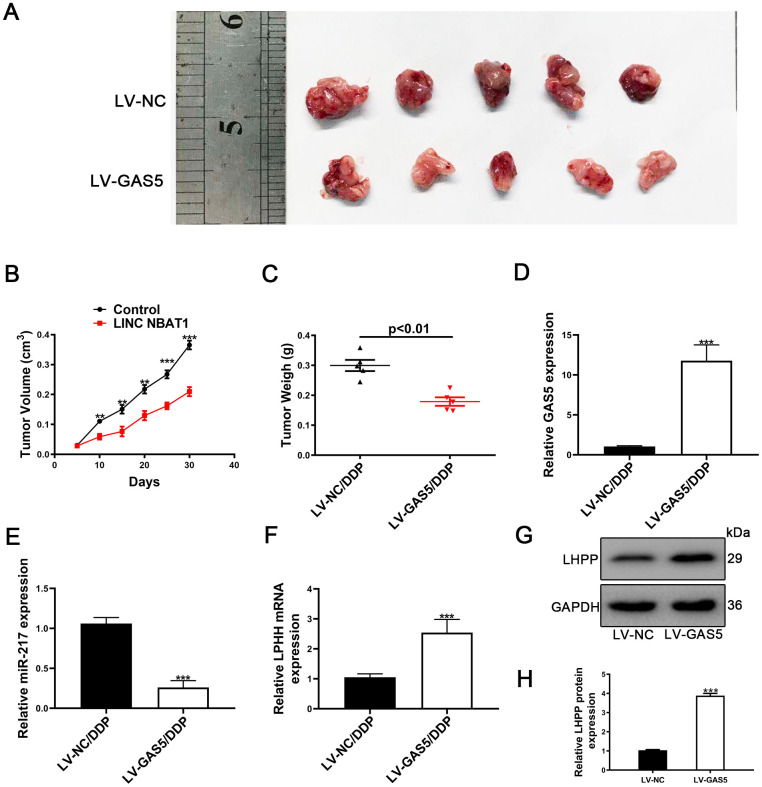
Figure 8.
Upregulation of GAS5 and its influence on tumor growth in vivo. (A) Nude mice carrying tumors from A549/DDP/LV-GAS5 and A549/DDP/LV-NC groups were presented. (B) Tumor growth curves were calculated every 5 days. (C) Tumor weight from A549/DDP/LV-GAS5 and A549/DDP/LV-NC groups was presented. (D) The relative expression of GAS5 in tumors from A549/DDP/LV-GAS5 and A549/DDP/LV-NC groups was determined by qRT-PCR. (E) The relative expression of miR-217 in tumors from A549/DDP/LV-GAS5 and A549/DDP/LV-NC groups was determined by qRT-PCR. (F) The relative mRNA expression of LHPP in tumors from A549/DDP/LV-GAS5 and A549/DDP/LV-NC groups was determined by qRT-PCR. (G) The relative protein expression of LHPP in tumors from A549/DDP/LV-GAS5 and A549/DDP/LV-NC groups was determined by Western blotting. *p<0.05, **p<0.01, ***p<0.001. (H) Quantitative analysis of LHPP protein expression in A549/DDP and H1299/DDP cells transfected with LV-NC or LV-GAS5 tumor tissue. Tumor xenograft experiments were performed within one-month and other experiments listed were performed in one-week intervals.

