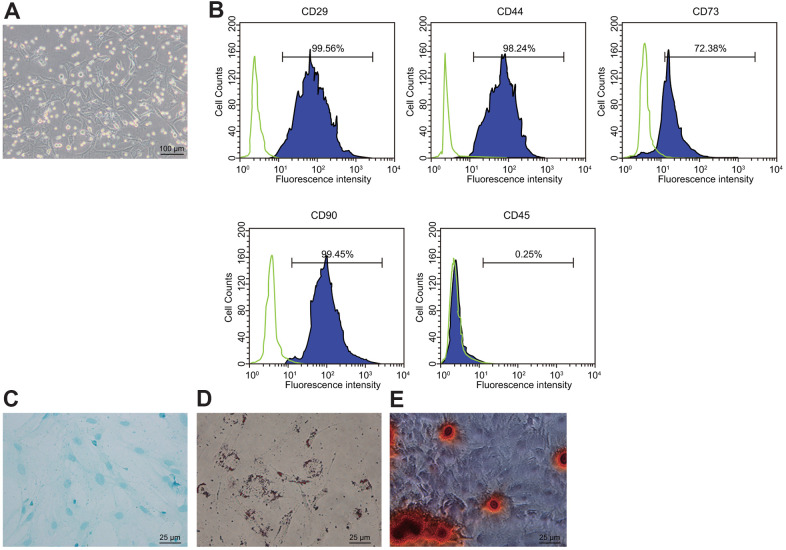
Figure 1.
Isolation and identification of BMSCs. (A) condition of primary BMSCs after adherent growth for 7 d (100 ×); (B) expression of surface markers CD29, CD44, CD73, CD90, and CD45 in the BMSCs detected by flow cytometry; (C) Oil red O staining for the BMSCs after adipogenic induction (400 ×); (D) alizarin red staining for the BDMSCs after osteogenic differentiation (400 ×); (E) Alcian blue staining for BMSCs after chondrocyte induction (400 ×).

