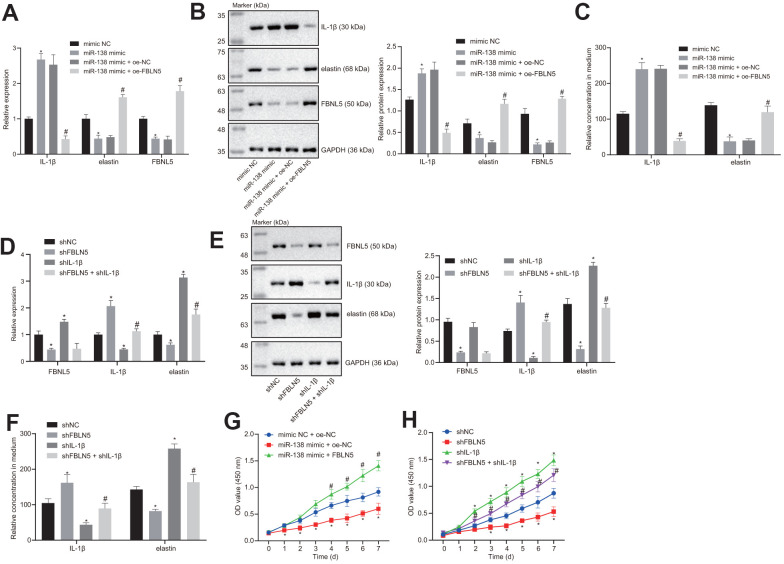
Figure 3.
miR-138 attenuates the proliferation of BMSCs by suppressing elastin and FBNL5 expression and potentiating IL-1β expression. (A) the mRNA expression of FBNL5, elastin, and IL-1β in BMSCs treated with miR-138 mimic alone or in the presence of oe-FBNL5 measured by RT-qPCR; (B) the protein expression of FBNL5, elastin, and IL-1β in BMSCs treated with miR-138 mimic alone or in the presence of oe-FBNL5 measured by western blot analysis; (C) the release of elastin and IL-1β in BMSCs treated with miR-138 mimic alone or in the presence of oe-FBNL5 measured by ELISA; (D) the mRNA expression of FBNL5, elastin and IL-1β in BMSCs treated with sh-FBNL5 and/or sh-IL-1β measured by RT-qPCR; (E) the protein expression of FBNL5, elastin, and IL-1β in BMSCs treated with sh-FBNL5 and/or sh-IL-1β measured by western blot analysis; (F) the release of elastin and IL-1β in BMSCs treated with sh-FBNL5 and/or sh-IL-1β measured by ELISA; (G) the OD value of BMSCs treated with miR-138 mimic alone or in the presence of oe-FBNL5 at the 0-7 d assessed by CCK-8; (H) the OD value of BMSCs treated with sh-FBNL5 and/or sh-IL-1β at the 0-7 d assessed by CCK-8. * p < 0.05 vs. BMSCs treated with mimic NC, sh-NC or mimic-NC + oe-NC; # p < 0.05 vs. BMSCs treated with miR-138 mimic + oe-NC or sh-FBLN5; statistical data were measurement data, and described as mean ± standard deviation. The unpaired t-test was conducted for comparison between two groups. The one-way ANOVA was adopted for comparison among multiple groups, followed by Tukey’s post hoc test. The repeated measures ANOVA was applied for the comparison of data at different time points, followed by Bonferroni’s correction. The experiment was repeated 3 times independently.

