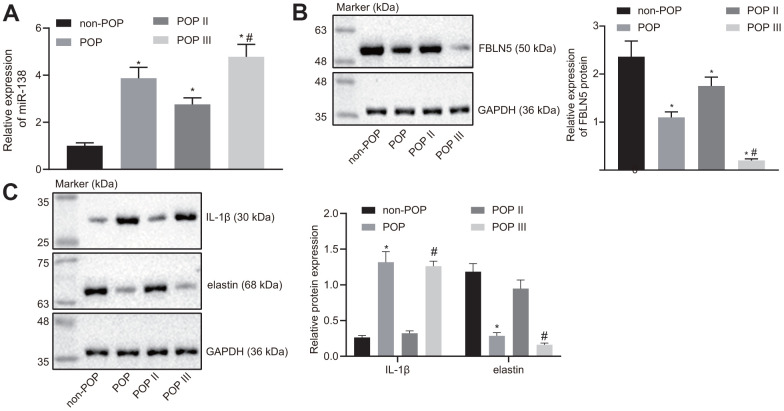
Figure 5.
miR-138 and IL-1β are overexpressed and FBLN5 and elastin are repressed in POP patients. (A) miR-138 expression in patients with POP or non-POP controls measured by RT-qPCR, N = 46; (B) the protein expression of FBLN5 in patients with POP or non-POP controls measured by western blot analysis; (C) the protein expression of IL-1β and elastin in patients with POP or non-POP controls measured by western blot analysis. * p < 0.05 vs. non-POP controls; # p < 0.05 vs. POP II patients; statistical data were measurement data and calculated as mean ± standard deviation. The one-way ANOVA was adopted for comparison among multiple groups, followed by Tukey’s post hoc test.

