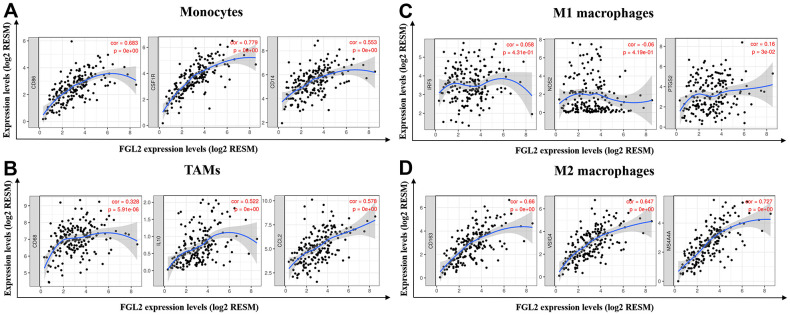
Figure 5.
FGL2 expression correlated with TAM polarization in ESCA. (A–D) Scatterplots depicting the correlations between the levels of FGL2 and genetic markers of monocytes (A), TAMs (B), M1 macrophages (C) and M2 macrophages (D). The following immune cell markers were assessed: CD86, CSF1R and CD14 of monocytes; CD68, CCL2 and IL-10 of TAMs; IRF5, NOS2 and PTGS2 of M1 macrophages; and CD163, VSIG4 and MS4A4A of M2 macrophages. P < 0.05 was considered statistically significant.

